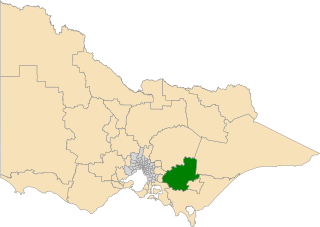
This is a list of electoral results for the district of Narracan in Victorian state elections.
Member | Party | Term | |
---|---|---|---|
Jim Balfour | Liberal | 1967–1982 | |
John Delzoppo | Liberal | 1982–1996 | |
Florian Andrighetto | Liberal | 1996–1999 | |
Ian Maxfield | Labor | 1999–2006 | |
Gary Blackwood | Liberal | 2006–2022 | |
Wayne Farnham | Liberal | 2023–present |
Party | Candidate | Votes | % | ±% | |
---|---|---|---|---|---|
Liberal | Wayne Farnham | 16,741 | 45.0 | −10.6 | |
Greens | Alyssa Weaver | 4,132 | 11.1 | +5.1 | |
Independent | Tony Wolfe | 4,110 | 11.0 | +11.0 | |
Democratic Labour | Sophia Camille De Wit | 2,641 | 7.1 | +7.1 | |
Freedom | Leonie Blackwell | 2,254 | 6.1 | +6.1 | |
One Nation | Casey Murphy | 2,246 | 6.0 | +6.0 | |
Independent | Annemarie McCabe | 1,437 | 3.9 | +3.9 | |
Liberal Democrats | Michael Abelman | 1,325 | 3.6 | +3.6 | |
Family First | Brendan Clarke | 1,089 | 2.9 | +2.9 | |
Animal Justice | Austin Cram | 849 | 2.3 | +2.3 | |
Independent | Ian Honey | 381 | 1.0 | +1.0 | |
Total formal votes | 37,205 | 93.4 | –1.4 | ||
Informal votes | 2,619 | 6.6 | +1.4 | ||
Turnout | 39,824 | 78.9 | −5.9 | ||
Two-candidate-preferred result | |||||
Liberal | Wayne Farnham | 23,448 | 63.0 | +3.0 | |
Independent | Tony Wolfe | 13,757 | 37.0 | +37.0 | |
Liberal hold | Swing | +3.0 |
Party | Candidate | Votes | % | ±% | |
---|---|---|---|---|---|
Liberal | Gary Blackwood | 23,207 | 51.72 | −3.48 | |
Labor | Christine Maxfield | 15,946 | 35.54 | +6.08 | |
Greens | William Hornstra | 2,679 | 5.97 | −2.99 | |
Independent | Carlo Ierfone | 1,613 | 3.59 | +3.59 | |
Independent | Guss Lambden | 1,425 | 3.18 | +3.18 | |
Total formal votes | 44,870 | 94.60 | −1.17 | ||
Informal votes | 2,559 | 5.40 | +1.17 | ||
Turnout | 47,429 | 90.85 | −3.22 | ||
Two-party-preferred result | |||||
Liberal | Gary Blackwood | 25,724 | 57.26 | −4.03 | |
Labor | Christine Maxfield | 19,203 | 42.74 | +4.03 | |
Liberal hold | Swing | −4.03 |
Party | Candidate | Votes | % | ±% | |
---|---|---|---|---|---|
Liberal | Gary Blackwood | 22,907 | 55.2 | −5.4 | |
Labor | Kate Marten | 12,223 | 29.5 | +3.7 | |
Greens | Malcolm McKelvie | 3,720 | 9.0 | +1.1 | |
Country Alliance | Dave Snelling | 1,673 | 4.0 | −0.1 | |
Rise Up Australia | Norman Baker | 973 | 2.3 | +2.3 | |
Total formal votes | 41,496 | 95.8 | −0.2 | ||
Informal votes | 1,829 | 4.2 | +0.2 | ||
Turnout | 43,325 | 94.1 | +1.2 | ||
Two-party-preferred result | |||||
Liberal | Gary Blackwood | 25,482 | 61.3 | −4.7 | |
Labor | Kate Marten | 16,095 | 38.7 | +4.7 | |
Liberal hold | Swing | −4.7 |
Party | Candidate | Votes | % | ±% | |
---|---|---|---|---|---|
Liberal | Gary Blackwood | 21,636 | 56.67 | +14.64 | |
Labor | Tony Flynn | 11,161 | 29.23 | −10.62 | |
Greens | Belinda Rogers | 2,967 | 7.77 | +0.61 | |
Country Alliance | Brian Dungey | 1,638 | 4.29 | +4.29 | |
Independent | Jenny Webb | 777 | 2.04 | +2.04 | |
Total formal votes | 38,179 | 96.14 | +0.01 | ||
Informal votes | 1,531 | 3.86 | −0.01 | ||
Turnout | 93.80 | 93.80 | +0.01 | ||
Two-party-preferred result | |||||
Liberal | Gary Blackwood | 23,814 | 62.39 | +9.74 | |
Labor | Tony Flynn | 14,353 | 37.61 | −9.74 | |
Liberal hold | Swing | +9.74 |
Party | Candidate | Votes | % | ±% | |
---|---|---|---|---|---|
Liberal | Gary Blackwood | 14,720 | 42.0 | +8.5 | |
Labor | Ian Maxfield | 13,956 | 39.8 | −6.7 | |
Greens | Kate Jackson | 2,506 | 7.2 | +1.3 | |
National | John Verhoeven | 2,065 | 5.9 | −2.4 | |
Family First | Terry McKenna | 1,366 | 3.9 | +3.9 | |
People Power | Roger Marks | 271 | 0.8 | +0.8 | |
Citizens Electoral Council | Steven Bird | 138 | 0.4 | +0.4 | |
Total formal votes | 35,022 | 96.1 | −0.9 | ||
Informal votes | 1,410 | 3.9 | +0.9 | ||
Turnout | 36,432 | 93.8 | |||
Two-party-preferred result | |||||
Liberal | Gary Blackwood | 18,440 | 52.7 | +9.5 | |
Labor | Ian Maxfield | 16,582 | 47.3 | −9.5 | |
Liberal gain from Labor | Swing | +9.5 |
Party | Candidate | Votes | % | ±% | |
---|---|---|---|---|---|
Labor | Ian Maxfield | 15,908 | 46.5 | +5.9 | |
Liberal | Karen Stoll | 11,469 | 33.5 | −9.7 | |
National | Ian Needham | 2,840 | 8.3 | +7.1 | |
Greens | Kate Jackson | 2,033 | 5.9 | +5.9 | |
Independent | Tony Sayers | 1,995 | 5.8 | +5.8 | |
Total formal votes | 34,245 | 97.0 | +0.1 | ||
Informal votes | 1,044 | 3.0 | −0.1 | ||
Turnout | 35,289 | 94.6 | |||
Two-party-preferred result | |||||
Labor | Ian Maxfield | 19,471 | 56.8 | +7.4 | |
Liberal | Karen Stoll | 14,794 | 43.2 | −7.4 | |
Labor gain from Liberal | Swing | +7.4 |
Party | Candidate | Votes | % | ±% | |
---|---|---|---|---|---|
Labor | Ian Maxfield | 13,074 | 45.6 | +3.7 | |
Liberal | Florian Andrighetto | 11,925 | 41.6 | −5.8 | |
Democrats | Michael Fozard | 1,534 | 5.3 | +5.3 | |
Shooters | Colin Dowling | 1,292 | 4.5 | +4.5 | |
Independent | Ray Mathieson | 504 | 1.8 | +1.8 | |
Independent | Heather Robinson | 355 | 1.2 | +1.2 | |
Total formal votes | 28,684 | 96.8 | −1.3 | ||
Informal votes | 939 | 3.2 | +1.3 | ||
Turnout | 29,623 | 93.5 | |||
Two-party-preferred result | |||||
Labor | Ian Maxfield | 15,063 | 52.5 | +4.1 | |
Liberal | Florian Andrighetto | 13,621 | 47.5 | −4.1 | |
Labor gain from Liberal | Swing | +4.1 |
Party | Candidate | Votes | % | ±% | |
---|---|---|---|---|---|
Liberal | Florian Andrighetto | 13,903 | 47.4 | −4.9 | |
Labor | Brendan Jenkins | 12,271 | 41.8 | +1.6 | |
Independent | Peter Wells | 2,135 | 7.3 | +7.3 | |
Natural Law | Lisa Barnes | 593 | 2.0 | +2.0 | |
Independent | Luke Van Der Meulen | 427 | 1.5 | +1.5 | |
Total formal votes | 29,329 | 98.2 | +0.5 | ||
Informal votes | 548 | 1.8 | −0.5 | ||
Turnout | 29,877 | 95.3 | |||
Two-party-preferred result | |||||
Liberal | Florian Andrighetto | 15,095 | 51.6 | −3.8 | |
Labor | Brendan Jenkins | 14,146 | 48.4 | +3.8 | |
Liberal hold | Swing | -3.8 |
Party | Candidate | Votes | % | ±% | |
---|---|---|---|---|---|
Liberal | John Delzoppo | 15,352 | 52.3 | +10.6 | |
Labor | Brendan Jenkins | 11,794 | 40.2 | −3.9 | |
Independent | Trisha Taig | 1,456 | 5.0 | +5.0 | |
Independent | John Cross | 731 | 2.5 | +2.5 | |
Total formal votes | 29,333 | 97.6 | +0.1 | ||
Informal votes | 712 | 2.4 | −0.1 | ||
Turnout | 30,045 | 96.4 | |||
Two-party-preferred result | |||||
Liberal | John Delzoppo | 16,219 | 55.4 | +3.7 | |
Labor | Brendan Jenkins | 13,080 | 44.6 | −3.7 | |
Liberal hold | Swing | +3.7 |
Party | Candidate | Votes | % | ±% | |
---|---|---|---|---|---|
Labor | Neil Young | 12,281 | 44.14 | −2.18 | |
Liberal | John Delzoppo | 11,612 | 41.73 | −1.87 | |
National | Kenneth Ipsen | 2,783 | 10.00 | +3.01 | |
Democrats | David White | 1,148 | 4.13 | +4.13 | |
Total formal votes | 27,824 | 97.50 | −0.47 | ||
Informal votes | 713 | 2.50 | +0.47 | ||
Turnout | 28,537 | 93.85 | −0.63 | ||
Two-party-preferred result | |||||
Liberal | John Delzoppo | 14,371 | 51.67 | +1.31 | |
Labor | Neil Young | 13,443 | 48.33 | −1.31 | |
Liberal hold | Swing | +1.31 |
Party | Candidate | Votes | % | ±% | |
---|---|---|---|---|---|
Labor | Robin Matthews | 12,619 | 46.3 | +0.4 | |
Liberal | John Delzoppo | 11,880 | 43.6 | +5.8 | |
National | Julia Ettery | 1,905 | 7.0 | −1.8 | |
Independent | John McNamara | 842 | 3.1 | +3.1 | |
Total formal votes | 27,246 | 98.0 | |||
Informal votes | 564 | 2.0 | |||
Turnout | 27,810 | 94.5 | |||
Two-party-preferred result | |||||
Liberal | John Delzoppo | 13,716 | 50.4 | +1.8 | |
Labor | Robin Matthews | 13,522 | 49.6 | −1.8 | |
Liberal notional gain from Labor | Swing | +1.8 |
Party | Candidate | Votes | % | ±% | |
---|---|---|---|---|---|
Labor | Richard Gubbins | 11,909 | 44.4 | +2.0 | |
Liberal | John Delzoppo | 10,503 | 39.2 | −4.6 | |
National | Douglas Hatfield | 2,427 | 9.1 | +0.1 | |
Democratic Labor | Brian Handley | 1,070 | 4.0 | +4.0 | |
Democrats | Nancye Yeates | 922 | 3.4 | −1.5 | |
Total formal votes | 26,831 | 97.7 | −0.3 | ||
Informal votes | 640 | 2.3 | +0.3 | ||
Turnout | 27,471 | 94.6 | +0.2 | ||
Two-party-preferred result | |||||
Liberal | John Delzoppo | 13,886 | 51.7 | −3.4 | |
Labor | Richard Gubbins | 12,945 | 48.3 | +3.4 | |
Liberal hold | Swing | -3.4 |
Party | Candidate | Votes | % | ±% | |
---|---|---|---|---|---|
Liberal | Jim Balfour | 11,023 | 43.8 | +8.2 | |
Labor | William Rutherford | 10,675 | 42.4 | +4.8 | |
National | Douglas Hatfield | 2,275 | 9.0 | −13.5 | |
Democrats | Alan Petschack | 1,221 | 4.9 | +4.9 | |
Total formal votes | 25,194 | 98.0 | −0.6 | ||
Informal votes | 521 | 2.0 | +0.6 | ||
Turnout | 25,715 | 94.4 | +0.3 | ||
Two-party-preferred result | |||||
Liberal | Jim Balfour | 13,878 | 55.1 | −5.1 | |
Labor | William Rutherford | 11,316 | 44.9 | +5.1 | |
Liberal hold | Swing | -5.1 |
Party | Candidate | Votes | % | ±% | |
---|---|---|---|---|---|
Labor | Pat Bartholomeusz | 8,897 | 37.6 | −4.3 | |
Liberal | Jim Balfour | 8,443 | 35.6 | −3.1 | |
National | Arthur Hewson | 5,331 | 22.5 | +9.7 | |
Democratic Labor | Brian Handley | 1,020 | 4.3 | −2.4 | |
Total formal votes | 23,691 | 98.6 | |||
Informal votes | 337 | 1.4 | |||
Turnout | 24,028 | 94.1 | |||
Two-party-preferred result | |||||
Liberal | Jim Balfour | 14,265 | 60.2 | +3.8 | |
Labor | Pat Bartholomeusz | 9,426 | 39.8 | −3.8 | |
Liberal hold | Swing | +3.8 |
Party | Candidate | Votes | % | ±% | |
---|---|---|---|---|---|
Liberal | Jim Balfour | 9,062 | 39.8 | +3.4 | |
Labor | Wilfred Bartholomeusz | 8,992 | 39.5 | +0.7 | |
Country | Alfred Bush | 3,163 | 13.9 | +0.1 | |
Democratic Labor | John Mann | 1,524 | 6.7 | −4.3 | |
Total formal votes | 22,741 | 98.0 | +0.6 | ||
Informal votes | 472 | 2.0 | −0.6 | ||
Turnout | 23,213 | 95.0 | −0.4 | ||
Two-party-preferred result | |||||
Liberal | Jim Balfour | 13,320 | 58.6 | +7.8 | |
Labor | Wilfred Bartholomeusz | 9,421 | 41.4 | −7.8 | |
Liberal hold | Swing | +7.8 |
Party | Candidate | Votes | % | ±% | |
---|---|---|---|---|---|
Labor | Wilfred Bartholomeusz | 8,125 | 38.8 | +8.3 | |
Liberal | Jim Balfour | 7,632 | 36.4 | −3.7 | |
Country | Reinhardt Reuter | 3,895 | 13.8 | −4.0 | |
Democratic Labor | Peter Saunders | 2,312 | 11.0 | −0.5 | |
Total formal votes | 20,964 | 97.4 | −0.2 | ||
Informal votes | 554 | 2.6 | +0.2 | ||
Turnout | 21,518 | 95.4 | −0.5 | ||
Two-party-preferred result | |||||
Liberal | Jim Balfour | 10,643 | 50.8 | −15.2 | |
Labor | Wilfred Bartholomeusz | 10,321 | 49.2 | +15.2 | |
Liberal hold | Swing | -15.2 |
Party | Candidate | Votes | % | ±% | |
---|---|---|---|---|---|
Liberal | Jim Balfour | 8,243 | 40.1 | +5.6 | |
Labor | George Wragg | 6,267 | 30.5 | 0.0 | |
Country | Daniel Vaughan | 3,667 | 17.9 | −4.2 | |
Democratic Labor | Peter Saunders | 2,367 | 11.5 | −1.4 | |
Total formal votes | 20,544 | 97.6 | |||
Informal votes | 504 | 2.4 | |||
Turnout | 21,048 | 95.9 | |||
Two-party-preferred result | |||||
Liberal | Jim Balfour | 13,568 | 66.0 | +0.5 | |
Labor | George Wragg | 6,976 | 34.0 | −0.5 | |
Liberal hold | Swing | +0.5 |
The electoral district of Narracan is an electoral district of the Victorian Legislative Assembly in Australia. It was first proclaimed in 1967 and has usually been held by the Liberal Party.
Eastern Victoria Region is one of the eight electoral regions of Victoria, Australia, which elects five members to the Victorian Legislative Council by proportional representation. The region was created in 2006 following the 2005 reform of the Victorian Legislative Council.
This is a list of electoral results for the Electoral district of Dandenong in Victorian state elections.
This is a list of electoral results for the Electoral district of Melbourne in Victorian state elections.
This is a list of electoral results for the district of Mulgrave in Victorian state elections.
This is a list of electoral results for the Electoral district of Narre Warren North in Victorian state elections.
This is a list of electoral results for the Electoral district of Nepean in Victorian state elections.
This is a list of electoral results for the Electoral district of Northcote in Victorian state elections.
This is a list of electoral results for the Electoral district of Pascoe Vale in Victorian state elections.
This is a list of electoral results for the Electoral district of Preston in Victorian state elections.
This is a list of electoral results for the Electoral district of Sandringham in Victorian state elections.
This is a list of electoral results for the district of South Barwon in Victorian state elections.
This is a list of electoral results for the Electoral district of Tarneit in Victorian state elections.
This is a list of electoral results for the Electoral district of Warrandyte in Victorian state elections.
This is a list of electoral results for the district of Yan Yean in Victorian state elections.
This is a list of electoral district results for the Victorian 2014 election for the Legislative Assembly.
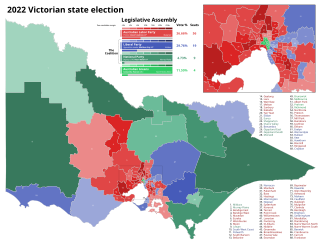
The 2022 Victorian state election was held on Saturday, 26 November 2022 to elect the 60th Parliament of Victoria. All 88 seats in the Legislative Assembly and all 40 seats in the Legislative Council were up for election at the time the writs were issued, however the election in the district of Narracan was deferred due to the death of a candidate.
The 2026 Victorian state election is expected to be held on 28 November 2026 to elect the 61st Parliament of Victoria. All 88 seats in the Legislative Assembly and all 40 seats in the Legislative Council will be up for election, presuming there are no new electorates added in a redistribution.
This is a list of electoral district results for the 2022 Victorian state election for the Legislative Assembly.
The 2023 Narracan state supplementary election was held on 28 January 2023 to elect the next member for the electoral district of Narracan in the Victorian Legislative Assembly, following the death of a nominated candidate prior to the 2022 Victorian state election.