This is a list of electoral results for the Electoral district of Lowan in Victorian state elections.
First incarnation (1889–1945) | |||
---|---|---|---|
Member | Party | Term | |
Richard Baker | Unaligned | 1889–1894 | |
Sir William Irvine | Unaligned | 1894–1906 | |
Robert Stanley | Ministerialist | 1906–1911 | |
Comm Liberal | |||
James Menzies | Comm Liberal | 1911–1920 | |
Nationalist | |||
Marcus Wettenhall | Farmers Union | 1920–1935 | |
Country | |||
Hamilton Lamb | Country | 1935–1943 | |
Wilfred Mibus | Country | 1944–1945 | |
Second incarnation (1955–1992) | |||
Member | Party | Term | |
Wilfred Mibus | Liberal & Country | 1955–1964 | |
Country | |||
Jim McCabe | Liberal | 1964–1967 | |
Ray Buckley | Country | 1967–1970 | |
Jim McCabe | Liberal | 1970–1979 | |
Bill McGrath | National Country | 1979–1982 | |
National | 1982–1992 | ||
Third incarnation (2002–present) | |||
Member | Party | Term | |
Hugh Delahunty | National | 2002–2014 | |
Emma Kealy | National | 2014–present |
Party | Candidate | Votes | % | ±% | |
---|---|---|---|---|---|
National | Emma Kealy | 25,482 | 59.0 | –0.7 | |
Labor | Mick Monaghan | 8,454 | 19.6 | −1.8 | |
Greens | Richard Lane | 2,575 | 6.0 | +0.6 | |
Independent | Amanda Mead | 2,384 | 5.5 | +5.5 | |
Angry Victorians | Richard Etherton | 1,710 | 3.9 | +3.9 | |
Family First | Robert Coleman | 1,573 | 3.6 | +3.6 | |
Animal Justice | Tamasin Ramsay | 1,019 | 2.4 | +2.1 | |
Total formal votes | 43,297 | 94.3 | −0.5 | ||
Informal votes | 2,612 | 5.7 | +0.5 | ||
Turnout | 45,909 | 89.7 | |||
Two-party-preferred result | |||||
National | Emma Kealy | 30,991 | 71.6 | +0.6 | |
Labor | Mick Monaghan | 12,288 | 28.4 | −0.6 | |
National hold | Swing | +0.6 | |||
Party | Candidate | Votes | % | ±% | |
---|---|---|---|---|---|
National | Emma Kealy | 25,554 | 67.0 | +12.9 | |
Labor | Maurice Billi | 7,675 | 20.1 | +1.5 | |
Independent | Barry Shea | 2,468 | 6.5 | +6.5 | |
Greens | Nkandu Beltz | 2,037 | 5.3 | −3.2 | |
Victorian Socialists | Trevor Grenfell | 434 | 1.1 | +1.1 | |
Total formal votes | 38,168 | 95.0 | −0.5 | ||
Informal votes | 2,002 | 5.0 | +0.5 | ||
Turnout | 40,170 | 93.5 | −1.5 | ||
Two-party-preferred result | |||||
National | Emma Kealy | 28,056 | 73.5 | +2.2 | |
Labor | Maurice Billi | 10,121 | 26.5 | −2.2 | |
National hold | Swing | +2.2 | |||
Party | Candidate | Votes | % | ±% | |
---|---|---|---|---|---|
National | Emma Kealy | 21,087 | 54.1 | −13.2 | |
Labor | Bob Scates | 7,243 | 18.6 | −3.6 | |
Independent | Katrina Rainsford | 5,532 | 14.2 | +14.2 | |
Greens | Nkandu Beltz | 3,324 | 8.5 | +2.9 | |
Country Alliance | Steve Price | 1,796 | 4.6 | +4.5 | |
Total formal votes | 38,982 | 95.5 | −0.7 | ||
Informal votes | 1,851 | 4.5 | +0.7 | ||
Turnout | 40,833 | 95.0 | −0.8 | ||
Two-party-preferred result | |||||
National | Emma Kealy | 27,773 | 71.3 | −0.7 | |
Labor | Bob Scates | 11,199 | 28.7 | +0.7 | |
National hold | Swing | −0.7 | |||
Party | Candidate | Votes | % | ±% | |
---|---|---|---|---|---|
National | Hugh Delahunty | 23,702 | 67.42 | +19.75 | |
Labor | Mandy Kirsopp | 7,783 | 22.14 | −0.23 | |
Greens | Ben Wilkie | 1,966 | 5.59 | +1.34 | |
Family First | Randall Reimer | 1,704 | 4.85 | +1.50 | |
Total formal votes | 35,155 | 96.27 | −0.15 | ||
Informal votes | 1,363 | 3.73 | +0.15 | ||
Turnout | 36,518 | 94.91 | +0.17 | ||
Two-party-preferred result | |||||
National | Hugh Delahunty | 25,337 | 72.08 | 0.00 | |
Labor | Mandy Kirsopp | 9,812 | 27.92 | 0.00 | |
National hold | Swing | 0.00 | |||
Party | Candidate | Votes | % | ±% | |
---|---|---|---|---|---|
National | Hugh Delahunty | 16,624 | 47.7 | +7.0 | |
Labor | Paul Battista | 7,803 | 22.4 | −4.7 | |
Liberal | Katrina Rainsford | 7,798 | 22.4 | −5.2 | |
Greens | Rob Daly | 1,483 | 4.3 | −0.3 | |
Family First | Graeme Presser | 1,168 | 3.3 | +3.3 | |
Total formal votes | 34,876 | 96.4 | −1.1 | ||
Informal votes | 1,295 | 3.6 | +1.1 | ||
Turnout | 36,171 | 94.7 | |||
Two-party-preferred result | |||||
National | Hugh Delahunty | 25,169 | 72.1 | +5.0 | |
Labor | Paul Battista | 9,748 | 27.9 | −5.0 | |
National hold | Swing | +5.0 | |||
Party | Candidate | Votes | % | ±% | |
---|---|---|---|---|---|
National | Hugh Delahunty | 14,568 | 40.7 | +21.9 | |
Liberal | Howard Templeton | 9,871 | 27.6 | −9.3 | |
Labor | Charles Williams | 9,683 | 27.1 | +4.3 | |
Greens | David Brain | 1,658 | 4.6 | +4.6 | |
Total formal votes | 35,780 | 97.5 | −0.3 | ||
Informal votes | 917 | 2.5 | +0.3 | ||
Turnout | 36,697 | 95.6 | |||
Two-party-preferred result | |||||
National | Hugh Delahunty | 24,001 | 67.1 | +5.2 | |
Labor | Charles Williams | 11,779 | 32.9 | −5.2 | |
National hold | Swing | +5.2 | |||
Party | Candidate | Votes | % | ±% | |
---|---|---|---|---|---|
National | Bill McGrath | 16,468 | 61.03 | −2.13 | |
Liberal | Roderick Coutts | 6,003 | 22.25 | +4.03 | |
Labor | Robert Luciani | 4,511 | 16.72 | −1.90 | |
Total formal votes | 26,982 | 98.62 | −0.29 | ||
Informal votes | 377 | 1.38 | +0.29 | ||
Turnout | 27,359 | 95.42 | −0.41 | ||
Two-party-preferred result | |||||
National | Bill McGrath | 22,134 | 82.04 | +2.17 | |
Labor | Robert Luciani | 4,845 | 17.96 | −2.17 | |
National hold | Swing | +2.17 | |||
Party | Candidate | Votes | % | ±% | |
---|---|---|---|---|---|
National | Bill McGrath | 17,138 | 63.2 | +14.8 | |
Labor | William Albon | 5,052 | 18.6 | −3.7 | |
Liberal | John Mann | 4,944 | 18.2 | −9.0 | |
Total formal votes | 27,134 | 98.9 | |||
Informal votes | 300 | 1.1 | |||
Turnout | 27,434 | 95.8 | |||
Two-party-preferred result | |||||
National | Bill McGrath | 21,761 | 80.2 | +4.5 | |
Labor | William Albon | 5,373 | 19.8 | −4.5 | |
National hold | Swing | +4.5 | |||
Party | Candidate | Votes | % | ±% | |
---|---|---|---|---|---|
National | Bill McGrath | 12,508 | 52.2 | +20.4 | |
Liberal | Robert Kosch | 5,701 | 23.8 | −20.8 | |
Labor | David Drake-Feary | 5,354 | 22.3 | −1.3 | |
Democrats | Zelma Furey | 402 | 1.7 | +1.7 | |
Total formal votes | 23,965 | 98.5 | 0.0 | ||
Informal votes | 352 | 1.5 | 0.0 | ||
Turnout | 24,317 | 95.1 | −0.1 | ||
Two-party-preferred result | |||||
National | Bill McGrath | 18,095 | 75.5 | +4.0 | |
Labor | David Drake-Feary | 5,870 | 24.5 | −4.0 | |
National hold | Swing | +4.0 | |||
Party | Candidate | Votes | % | ±% | |
---|---|---|---|---|---|
Liberal | Jim McCabe | 10,564 | 44.6 | +1.1 | |
National | Bill McGrath | 7,535 | 31.8 | +5.1 | |
Labor | David Drake-Feary | 5,599 | 23.6 | +2.3 | |
Total formal votes | 23,698 | 98.5 | +0.4 | ||
Informal votes | 353 | 1.5 | −0.4 | ||
Turnout | 24,051 | 95.2 | −0.1 | ||
Two-party-preferred result | |||||
National | Bill McGrath | 16,941 | 71.5 | −3.0 | |
Labor | David Drake-Feary | 6,757 | 28.5 | +3.0 | |
Two-candidate-preferred result | |||||
National | Bill McGrath | 11,976 | 50.5 | +12.2 | |
Liberal | Jim McCabe | 11,722 | 49.5 | −12.2 | |
National gain from Liberal | Swing | +12.2 | |||
Party | Candidate | Votes | % | ±% | |
---|---|---|---|---|---|
Liberal | Jim McCabe | 10,052 | 43.5 | −0.1 | |
National | Howard Ellis | 6,174 | 26.7 | +6.3 | |
Labor | Brian Brooke | 4,923 | 21.3 | −6.8 | |
Independent | Francis Petering | 1,164 | 5.0 | +5.0 | |
Democratic Labor | Kevin Dunn | 788 | 3.4 | −1.5 | |
Total formal votes | 23,101 | 98.1 | |||
Informal votes | 451 | 1.9 | |||
Turnout | 23,552 | 95.3 | |||
Two-candidate-preferred result | |||||
Liberal | Jim McCabe | 14,249 | 61.7 | −5.8 | |
National | Howard Ellis | 8,852 | 38.3 | +38.3 | |
Liberal hold | Swing | N/A | |||
Party | Candidate | Votes | % | ±% | |
---|---|---|---|---|---|
Liberal | Jim McCabe | 8,220 | 44.9 | +11.0 | |
Labor | Arthur Rowe | 4,471 | 24.5 | −2.1 | |
Country | Graeme Smith | 3,966 | 21.7 | −10.8 | |
Democratic Labor | Kevin Dunn | 843 | 4.6 | −2.4 | |
Independent | Clifford Dodds | 785 | 4.3 | +4.3 | |
Total formal votes | 18,285 | 98.3 | 0.0 | ||
Informal votes | 309 | 1.7 | 0.0 | ||
Turnout | 18,594 | 95.4 | −1.7 | ||
Two-party-preferred result | |||||
Liberal | Jim McCabe | 13,260 | 72.5 | +3.4 | |
Labor | Arthur Rowe | 5,025 | 27.5 | −3.4 | |
Liberal hold | Swing | +3.4 | |||
Party | Candidate | Votes | % | ±% | |
---|---|---|---|---|---|
Liberal | Jim McCabe | 6,008 | 33.9 | −6.2 | |
Country | Ray Buckley | 5,754 | 32.5 | −1.1 | |
Labor | Gustav Lehmann | 4,714 | 26.6 | +5.9 | |
Democratic Labor | John Giles | 1,240 | 7.0 | +1.4 | |
Total formal votes | 17,716 | 98.3 | −0.3 | ||
Informal votes | 304 | 1.7 | +0.3 | ||
Turnout | 18,020 | 97.1 | +0.2 | ||
Two-party-preferred result | |||||
Liberal | Jim McCabe | 12,241 | 69.1 | −5.9 | |
Labor | Gustav Lehmann | 5,475 | 30.9 | +5.9 | |
Two-candidate-preferred result | |||||
Liberal | Jim McCabe | 9,940 | 56.1 | +8.8 | |
Country | Ray Buckley | 7,776 | 43.9 | −8.8 | |
Liberal gain from Country | Swing | +8.8 | |||
Party | Candidate | Votes | % | ±% | |
---|---|---|---|---|---|
Liberal | Jim McCabe | 7,181 | 40.1 | +2.3 | |
Country | Ray Buckley | 6,024 | 33.6 | −16.7 | |
Labor | Roslyn Snow | 3,715 | 20.7 | +17.1 | |
Democratic Labor | Michael Grimes | 1,007 | 5.6 | −2.7 | |
Total formal votes | 17,927 | 98.6 | |||
Informal votes | 260 | 1.4 | |||
Turnout | 18,187 | 96.9 | |||
Two-party-preferred result | |||||
Country | Ray Buckley | 13,439 | 75.0 | ||
Labor | Roslyn Snow | 4,488 | 25.0 | ||
Two-candidate-preferred result | |||||
Country | Ray Buckley | 9,448 | 52.7 | −3.3 | |
Liberal | Jim McCabe | 8,479 | 47.3 | +3.3 | |
Country gain from Liberal | Swing | -3.3 | |||
Party | Candidate | Votes | % | ±% | |
---|---|---|---|---|---|
Country | Lloyd Atkin | 9,167 | 45.7 | +45.7 | |
Liberal and Country | Jim McCabe | 9,146 | 45.6 | −13.7 | |
Democratic Labor | Frits Albers | 1,760 | 8.8 | −1.8 | |
Total formal votes | 20,073 | 98.7 | −0.1 | ||
Informal votes | 261 | 1.3 | +0.1 | ||
Turnout | 20,334 | 96.2 | +0.2 | ||
Two-candidate-preferred result | |||||
Liberal and Country | Jim McCabe | 10,398 | 51.8 | −16.5 | |
Country | Lloyd Atkin | 9,675 | 48.2 | +48.2 | |
Liberal and Country hold | Swing | -16.5 | |||
Party | Candidate | Votes | % | ±% | |
---|---|---|---|---|---|
Liberal and Country | Wilfred Mibus | 11,699 | 59.3 | +4.8 | |
Labor | James Redford | 5,933 | 30.1 | +30.1 | |
Democratic Labor | Derek Williams | 2,091 | 10.6 | −6.0 | |
Total formal votes | 19,723 | 98.8 | +0.1 | ||
Informal votes | 245 | 1.2 | −0.1 | ||
Turnout | 19,968 | 96.0 | −0.4 | ||
Two-party-preferred result | |||||
Liberal and Country | Wilfred Mibus | 13,477 | 68.3 | −0.7 | |
Labor | James Redford | 6,246 | 31.7 | +0.7 | |
Liberal and Country hold | Swing | -0.7 | |||
Party | Candidate | Votes | % | ±% | |
---|---|---|---|---|---|
Liberal and Country | Wilfred Mibus | 10,679 | 54.5 | ||
Country | Ian McCann | 5,664 | 28.9 | ||
Democratic Labor | Edgar McMahon | 3,258 | 16.6 | ||
Total formal votes | 19,601 | 98.7 | |||
Informal votes | 257 | 1.3 | |||
Turnout | 19,858 | 96.4 | |||
Two-candidate-preferred result | |||||
Liberal and Country | Wilfred Mibus | 12,308 | 62.8 | ||
Country | Ian McCann | 7,293 | 37.2 | ||
Liberal and Country hold | Swing | ||||
Party | Candidate | Votes | % | ±% | |
---|---|---|---|---|---|
Liberal and Country | Wilfred Mibus | 11,546 | 68.1 | ||
Country | Griffith Perkins | 5,418 | 31.9 | ||
Total formal votes | 16,964 | 98.2 | |||
Informal votes | 316 | 1.8 | |||
Turnout | 17,280 | 96.3 | |||
Liberal and Country hold | Swing | ||||
Party | Candidate | Votes | % | ±% | |
---|---|---|---|---|---|
Labor | John Tripovich | 4,201 | 42.07 | n/a | |
Country | Wilfred Mibus | 4,000 | 40.06 | n/a | |
Unendorsed Country | William Armstrong | 1,785 | 17.88 | n/a | |
Total formal votes | 9,986 | n/a | n/a | ||
Two-party-preferred result | |||||
Country | Wilfred Mibus | 5,223 | 52.30 | n/a | |
Labor | John Tripovich | 4,763 | 47.70 | n/a | |
Country hold | Swing | N/A | |||
Party | Candidate | Votes | % | ±% | |
---|---|---|---|---|---|
Country | Hamilton Lamb | unopposed | |||
Country hold | Swing | ||||
Party | Candidate | Votes | % | ±% | |
---|---|---|---|---|---|
Country | Hamilton Lamb | 5,525 | 47.8 | −18.0 | |
Independent | Winton Turnbull | 2,962 | 25.7 | +25.7 | |
United Australia | Arthur Bennett | 2,267 | 19.6 | −14.6 | |
Independent | Marcus Wettenhall | 794 | 7.4 | +7.4 | |
Total formal votes | 11,548 | 98.1 | −1.2 | ||
Informal votes | 223 | 1.9 | +1.2 | ||
Turnout | 11,771 | 94.9 | +0.5 | ||
Two-candidate-preferred result | |||||
Country | Hamilton Lamb | 55.5 | −10.3 | ||
Independent | Winton Turnbull | 44.5 | +44.5 | ||
Country hold | Swing | N/A | |||
Party | Candidate | Votes | % | ±% | |
---|---|---|---|---|---|
Country | Hamilton Lamb | 7,514 | 65.8 | +10.8 | |
United Australia | Jabez Potts | 3,899 | 34.2 | +34.2 | |
Total formal votes | 11,413 | 99.3 | −0.2 | ||
Informal votes | 78 | 0.7 | +0.2 | ||
Turnout | 11,491 | 94.4 | −0.1 | ||
Country hold | Swing | N/A | |||
Party | Candidate | Votes | % | ±% | |
---|---|---|---|---|---|
Country | Hamilton Lamb | 6,173 | 55.0 | +55.0 | |
Country | Marcus Wettenhall | 5,043 | 45.0 | −17.3 | |
Total formal votes | 11,216 | 99.5 | +1.4 | ||
Informal votes | 57 | 0.5 | −1.4 | ||
Turnout | 11,273 | 94.5 | −2.1 | ||
Country hold | Swing | N/A | |||
Party | Candidate | Votes | % | ±% | |
---|---|---|---|---|---|
Country | Marcus Wettenhall | 6,745 | 62.3 | +15.8 | |
United Australia | Frederick Thompson | 4,081 | 37.7 | +37.7 | |
Total formal votes | 10,826 | 98.1 | −0.7 | ||
Informal votes | 206 | 1.9 | +0.7 | ||
Turnout | 11,032 | 96.6 | +1.5 | ||
Country hold | Swing | N/A | |||
Party | Candidate | Votes | % | ±% | |
---|---|---|---|---|---|
Country | Marcus Wettenhall | 4,922 | 46.5 | −11.2 | |
Labor | James McDonald | 3,475 | 32.8 | +32.8 | |
Country Progressive | Albert Bussau | 2,189 | 20.7 | −21.5 | |
Total formal votes | 10,586 | 98.8 | +0.5 | ||
Informal votes | 130 | 1.2 | −0.5 | ||
Turnout | 10,716 | 95.1 | +4.0 | ||
Two-party-preferred result | |||||
Country | Marcus Wettenhall | 6,168 | 58.3 | +0.6 | |
Labor | James McDonald | 4,418 | 41.7 | +41.7 | |
Country hold | Swing | N/A | |||
Party | Candidate | Votes | % | ±% | |
---|---|---|---|---|---|
Country | Marcus Wettenhall | 5,633 | 57.7 | ||
Country Progressive | George Clyne | 4,127 | 42.2 | ||
Total formal votes | 9,760 | 98.3 | |||
Informal votes | 167 | 1.7 | |||
Turnout | 9,927 | 91.1 | |||
Country hold | Swing | ||||
Party | Candidate | Votes | % | ±% | |
---|---|---|---|---|---|
Country | Marcus Wettenhall | 2,959 | 42.9 | −7.3 | |
Nationalist | James Menzies | 2,400 | 34.8 | −14.8 | |
Country | Harold Glowrey | 1,152 | 16.7 | +16.7 | |
Nationalist | William Bolwell | 392 | 5.7 | +5.7 | |
Total formal votes | 6,903 | 98.5 | +0.8 | ||
Informal votes | 107 | 1.5 | −0.8 | ||
Turnout | 7,010 | 66.9 | −2.8 | ||
Two-candidate-preferred result | |||||
Country | Marcus Wettenhall | 3,877 | 56.2 | +6.0 | |
Nationalist | James Menzies | 3,026 | 43.8 | −6.0 | |
Country hold | Swing | +6.0 | |||
Party | Candidate | Votes | % | ±% | |
---|---|---|---|---|---|
Victorian Farmers | Marcus Wettenhall | 3,320 | 50.2 | −4.4 | |
Nationalist | James Menzies | 3,295 | 49.8 | +4.4 | |
Total formal votes | 6,615 | 99.3 | +2.4 | ||
Informal votes | 45 | 0.7 | −2.4 | ||
Turnout | 6,657 | 69.7 | +2.0 | ||
Victorian Farmers hold | Swing | -4.4 | |||
Party | Candidate | Votes | % | ±% | |
---|---|---|---|---|---|
Victorian Farmers | Marcus Wettenhall | 3,246 | 54.6 | +54.6 | |
Nationalist | James Menzies | 2,853 | 45.4 | ||
Total formal votes | 6,279 | 96.9 | |||
Informal votes | 201 | 3.1 | |||
Turnout | 6,480 | 67.7 | |||
Victorian Farmers gain from Nationalist | Swing | N/A | |||
Party | Candidate | Votes | % | ±% | |
---|---|---|---|---|---|
Nationalist | James Menzies | unopposed | |||
Nationalist hold | Swing | ||||
Party | Candidate | Votes | % | ±% | |
---|---|---|---|---|---|
Liberal | James Menzies | unopposed | |||
Liberal hold | Swing | ||||
Party | Candidate | Votes | % | ±% | |
---|---|---|---|---|---|
Liberal | James Menzies | 4,464 | 77.1 | N/A | |
Labor | George McGowan | 1,328 | 22.9 | +22.9 | |
Total formal votes | 5,792 | 98.3 | |||
Informal votes | 101 | 1.7 | |||
Turnout | 5,893 | 65.0 | |||
Liberal hold | Swing | N/A | |||
Prahran is an electoral district of the Legislative Assembly in the Australian state of Victoria. It was created by the Electoral Act Amendment Act 1888, taking effect at the 1889 elections. The electorate is the state’s smallest by area, covering a little under 11 km2 in the inner south-east of Melbourne. It includes the suburbs of South Yarra, Prahran and Windsor, as well as parts of Southbank, St Kilda and St Kilda East.
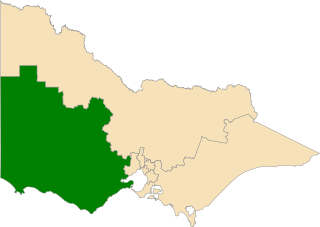
Western Victoria Region is one of the eight electoral regions of Victoria, Australia, which elects five members to the Victorian Legislative Council by proportional representation. The region was created in 2006 following the 2005 reform of the Victorian Legislative Council.
The electoral district of Lowan is a rural Victorian Legislative Assembly electoral district of the Victorian Parliament. It is located within the Western Victoria Region of the Legislative Council. It was initially created by the Electoral Act Amendment Act 1888, taking effect at the 1889 elections. It is the state’s biggest electorate by area, covering about 41,858 km².
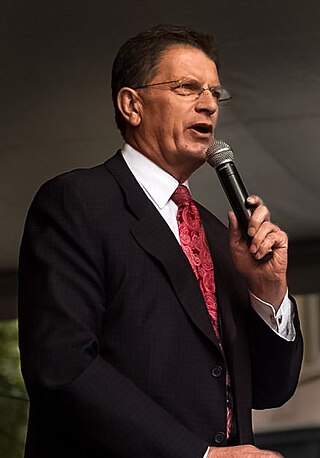
The 2010 Victorian state election, held on Saturday, 27 November 2010, was for the 57th Parliament of Victoria. The election was to elect all 88 members of the Legislative Assembly and all 40 members of the Legislative Council. The incumbent centre-left Labor Party government, led by John Brumby, was defeated by the centre-right Liberal/National Coalition opposition, led by Ted Baillieu. The election gave the Coalition a one-seat majority in both houses of parliament.
Ripon is a single member electoral district of the Victorian Legislative Assembly. It is a rural electorate based in western Victoria. In 1946 the electoral district of Ripon was first contested but then abolished in the 1955 election after being held by Labor for seven of these years. Ripon was re-created in 1976, essentially as a replacement for Hampden and Kara Kara.
This is a list of electoral results for the Electoral district of Albert Park in Victorian state elections from 1889 to the present.
This is a list of electoral results for the Electoral district of Broadmeadows in Victorian state elections.
This is a list of electoral results for the Electoral district of Footscray in Victorian state elections.
This is a list of electoral results for the Electoral district of Melbourne in Victorian state elections.
This is a list of electoral results for the Electoral district of Preston in Victorian state elections.
This is a list of electoral results for the Electoral district of Richmond in Victorian state elections.
This is a list of electoral results for the Electoral district of Rodney in Victorian state elections.
This is a list of electoral results for the Electoral district of Swan Hill in Victorian state elections.
This is a list of electoral results for the Electoral district of Williamstown in Victorian state elections.
A by-election was held for the Victorian Legislative Assembly seat of Melbourne on Saturday 21 July 2012. This was triggered by the resignation of former minister and state Labor MLA Bronwyn Pike which she announced on 7 May 2012.
This is a list of electoral district results for the Victorian 1988 election for the Legislative Assembly.
This is a list of electoral district results for the Victorian 1982 election.
This is a list of electoral district results for the Victorian 1967 election.
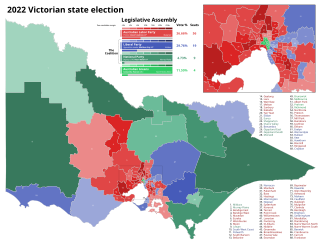
The 2022 Victorian state election was held on Saturday, 26 November 2022 to elect the 60th Parliament of Victoria. All 88 seats in the Legislative Assembly and all 40 seats in the Legislative Council were up for election at the time the writs were issued, however the election in the district of Narracan was deferred due to the death of a candidate.
The 2026 Victorian state election is expected to be held on 28 November 2026 to elect the 61st Parliament of Victoria. All 88 seats in the Legislative Assembly and all 40 seats in the Legislative Council will be up for election, presuming there are no new electorates added in a redistribution.