This is a list of electoral results for the Electoral district of Northcote in Victorian state elections.
Member | Party | Term | |
---|---|---|---|
John Cain | Labor | 1927–1957 | |
Frank Wilkes | Labor | 1957–1988 | |
Tony Sheehan | Labor | 1988–1998 | |
Mary Delahunty | Labor | 1998 by–2006 | |
Fiona Richardson | Labor | 2006–2017 | |
Lidia Thorpe | Greens | 2017 by–2018 | |
Kat Theophanous | Labor | 2018–present | |
Party | Candidate | Votes | % | ±% | |
---|---|---|---|---|---|
Labor | Kat Theophanous | 17,303 | 40.6 | −1.1 | |
Greens | Campbell Gome | 12,797 | 30.0 | −9.5 | |
Liberal | Stewart Todhunter | 5,205 | 12.2 | +1.5 | |
Victorian Socialists | Kath Larkin | 2,776 | 6.5 | +6.5 | |
Reason | April Clarke | 1,539 | 3.6 | +0.2 | |
Animal Justice | Tim Oseckas | 757 | 1.8 | −0.7 | |
Freedom | Anastacia Ntouni | 729 | 1.7 | +1.7 | |
Liberal Democrats | Anthony Cave | 530 | 1.2 | +0.1 | |
Independent | Adrian Whitehead | 518 | 1.2 | +1.2 | |
Family First | Kathrine Ashton | 408 | 0.9 | +0.9 | |
Independent | Ashish Verma | 80 | 0.2 | +0.2 | |
Total formal votes | 42,642 | 94.5 | −1.1 | ||
Informal votes | 2,445 | 5.4 | +1.1 | ||
Turnout | 45,087 | 89.5 | +0.4 | ||
Notional two-party-preferred count | |||||
Labor | Kat Theophanous | 34,840 | 81.7 | ||
Liberal | Stewart Todhunter | 7,802 | 18.3 | ||
Two-candidate-preferred result | |||||
Labor | Kat Theophanous | 21,413 | 50.2 | −1.5 | |
Greens | Campbell Gome | 21,229 | 49.8 | +1.5 | |
Labor hold | Swing | –1.5 | |||
Party | Candidate | Votes | % | ±% | |
---|---|---|---|---|---|
Labor | Kat Theophanous | 17,748 | 41.71 | +0.73 | |
Greens | Lidia Thorpe | 16,816 | 39.52 | +3.24 | |
Liberal | John MacIsaac | 4,570 | 10.74 | −5.74 | |
Reason | Franca Smarrelli | 1,448 | 3.40 | +3.40 | |
Animal Justice | David Bramante | 1,026 | 2.41 | +0.67 | |
Liberal Democrats | Samuel Fink | 500 | 1.18 | +1.18 | |
Independent | Bryony Edwards | 444 | 1.04 | +0.21 | |
Total formal votes | 42,552 | 95.70 | −0.08 | ||
Informal votes | 1,911 | 4.30 | +0.08 | ||
Turnout | 44,463 | 91.05 | −0.61 | ||
Notional two-party-preferred count | |||||
Labor | Kat Theophanous | 35,417 | 83.23 | +3.41 | |
Liberal | John MacIsaac | 7,135 | 16.77 | −3.41 | |
Two-candidate-preferred result | |||||
Labor | Kat Theophanous | 22,004 | 51.71 | −4.33 | |
Greens | Lidia Thorpe | 20,548 | 48.29 | +4.33 | |
Labor gain from Greens | Swing | −4.33 | |||
Party | Candidate | Votes | % | ±% | |
---|---|---|---|---|---|
Greens | Lidia Thorpe | 16,319 | 45.2 | +8.9 | |
Labor | Clare Burns | 12,779 | 35.4 | −5.6 | |
Independent | Vince Fontana | 1,864 | 5.2 | +5.2 | |
Liberal Democrats | Dean Rossiter | 1,497 | 4.1 | +4.1 | |
Independent Reason | Laura Chipp | 1,152 | 3.2 | +3.2 | |
Animal Justice | Nina Lenk | 773 | 2.1 | +0.4 | |
Independent | Philip Cooper | 436 | 1.2 | +1.2 | |
Independent | Russell Hayward | 360 | 1.0 | +1.0 | |
Independent | Joseph Toscano | 331 | 0.9 | +0.9 | |
Independent | Nevena Spirovska | 215 | 0.6 | +0.6 | |
Independent | Brian Sanaghan | 208 | 0.6 | +0.6 | |
Save The Planet | Bryony Edwards | 54 | 0.4 | −0.4 | |
Total formal votes | 36,088 | 94.9 | −0.9 | ||
Informal votes | 1,940 | 5.1 | +0.9 | ||
Turnout | 38,028 | 79.0 | −12.6 | ||
Two-candidate-preferred result | |||||
Greens | Lidia Thorpe | 20,137 | 55.6 | +11.6 | |
Labor | Clare Burns | 16,080 | 44.4 | −11.6 | |
After distribution of preferences | |||||
Greens | Lidia Thorpe | 18,380 | 50.9 | N/A | |
Labor | Clare Burns | 14,410 | 39.9 | N/A | |
Independent | Vince Fontana | 3,298 | 9.1 | N/A | |
Greens gain from Labor | Swing | +11.6 |
Party | Candidate | Votes | % | ±% | |
---|---|---|---|---|---|
Labor | Fiona Richardson | 15,928 | 41.0 | −3.1 | |
Greens | Trent McCarthy | 14,101 | 36.3 | +4.4 | |
Liberal | Anthony D'Angelo | 6,407 | 16.5 | −3.2 | |
The Basics Rock 'n' Roll | Jamie McCarney | 1,043 | 2.7 | +2.7 | |
Animal Justice | Georgina Purcell | 678 | 1.7 | +1.7 | |
Family First | Helen Fenn | 390 | 1.0 | +1.0 | |
Independent | Bryony Edwards | 324 | 0.8 | +0.8 | |
Total formal votes | 38,871 | 95.8 | −0.0 | ||
Informal votes | 1,713 | 4.2 | +0.0 | ||
Turnout | 40,584 | 91.7 | +2.1 | ||
Notional two-party-preferred count | |||||
Labor | Fiona Richardson | 31,027 | 79.8 | +4.3 | |
Liberal | Anthony D'Angelo | 7,844 | 20.2 | −4.3 | |
Two-candidate-preferred result | |||||
Labor | Fiona Richardson | 21,783 | 56.0 | −4.2 | |
Greens | Trent McCarthy | 17,088 | 44.0 | +4.2 | |
Labor hold | Swing | −4.2 | |||
Party | Candidate | Votes | % | ±% | |
---|---|---|---|---|---|
Labor | Fiona Richardson | 15,917 | 44.94 | −7.63 | |
Greens | Anne Martinelli | 10,927 | 30.85 | +3.44 | |
Liberal | Steve Moran | 6,863 | 19.37 | +4.08 | |
Sex Party | Robert Bishop | 1,098 | 3.10 | +3.10 | |
Independent | Darren Lewin-Hill | 404 | 1.14 | −0.39 | |
Independent | Dominic Marino | 213 | 0.60 | +0.60 | |
Total formal votes | 35,422 | 95.76 | +0.41 | ||
Informal votes | 1,567 | 4.24 | −0.41 | ||
Turnout | 36,989 | 91.50 | +0.97 | ||
Notional two-party-preferred count | |||||
Labor | Fiona Richardson | 26,833 | 75.9 | −4.4 | |
Liberal | Steve Moran | 8,525 | 24.1 | +4.4 | |
Two-candidate-preferred result | |||||
Labor | Fiona Richardson | 21,666 | 61.23 | +2.71 | |
Greens | Anne Martinelli | 13,716 | 38.77 | −2.71 | |
Labor hold | Swing | +2.71 | |||
Party | Candidate | Votes | % | ±% | |
---|---|---|---|---|---|
Labor | Fiona Richardson | 17,508 | 52.6 | −2.6 | |
Greens | Alex Bhathal | 9,131 | 27.4 | +2.0 | |
Liberal | Graham Watt | 5,092 | 15.3 | −1.5 | |
Family First | Daniel Willis | 1,065 | 3.2 | +3.2 | |
Independent | Darren Lewin-Hill | 511 | 1.5 | +1.5 | |
Total formal votes | 33,307 | 95.3 | −0.5 | ||
Informal votes | 1,625 | 4.7 | +0.5 | ||
Turnout | 34,932 | 90.5 | |||
Notional two-party-preferred count | |||||
Labor | Fiona Richardson | 26,737 | 80.3 | +2.0 | |
Liberal | Graham Watt | 6,562 | 19.7 | −2.0 | |
Two-candidate-preferred result | |||||
Labor | Fiona Richardson | 19,484 | 58.5 | +0.6 | |
Greens | Alex Bhathal | 13,813 | 41.5 | −0.6 | |
Labor hold | Swing | +0.6 | |||
Party | Candidate | Votes | % | ±% | |
---|---|---|---|---|---|
Labor | Mary Delahunty | 18,229 | 55.2 | −11.2 | |
Greens | Sarah Nicholson | 8,394 | 25.4 | +25.4 | |
Liberal | Graham Watt | 5,550 | 16.8 | −9.2 | |
Socialist Alliance | Jackie Lynch | 598 | 1.8 | +1.8 | |
Citizens Electoral Council | Paul Gallagher | 260 | 0.8 | +0.8 | |
Total formal votes | 33,031 | 95.8 | −0.1 | ||
Informal votes | 1,434 | 4.2 | +0.1 | ||
Turnout | 34,465 | 91.4 | |||
Notional two-party-preferred count | |||||
Labor | Mary Delahunty | 25,857 | 78.3 | +5.7 | |
Liberal | Graham Watt | 7,157 | 21.7 | −5.7 | |
Two-candidate-preferred result | |||||
Labor | Mary Delahunty | 19,103 | 57.9 | −14.7 | |
Greens | Sarah Nicholson | 13,892 | 42.1 | +42.1 | |
Labor hold | Swing | -14.7 | |||
Party | Candidate | Votes | % | ±% | |
---|---|---|---|---|---|
Labor | Mary Delahunty | 20,681 | 66.1 | +6.5 | |
Liberal | Elizabeth Richardson | 8,124 | 26.0 | −2.2 | |
Independent | Susanna Duffy | 2,480 | 7.9 | +7.9 | |
Total formal votes | 31,285 | 96.0 | −0.2 | ||
Informal votes | 1,306 | 4.0 | +0.2 | ||
Turnout | 32,591 | 91.3 | |||
Two-party-preferred result | |||||
Labor | Mary Delahunty | 22,733 | 72.7 | +2.8 | |
Liberal | Elizabeth Richardson | 8,552 | 27.3 | −2.8 | |
Labor hold | Swing | +2.8 | |||
Party | Candidate | Votes | % | ±% | |
---|---|---|---|---|---|
Labor | Mary Delahunty | 16,954 | 60.0 | +0.4 | |
Democrats | Kern Saunders | 7,439 | 26.3 | +26.3 | |
One Nation | Nikolas Kavalenka | 1,690 | 6.0 | +6.0 | |
Greens | Gurm Sekhon | 1,081 | 3.8 | +3.8 | |
Independent | Denis Evans | 555 | 2.0 | +2.0 | |
Independent | Maurice Sibelle | 472 | 1.7 | +1.7 | |
Abolish Child Support | Abboud Haidar | 75 | 0.3 | +0.3 | |
Total formal votes | 28,266 | 95.4 | −0.8 | ||
Informal votes | 1,373 | 4.6 | +0.8 | ||
Turnout | 29,639 | 85.2 | |||
Two-candidate-preferred result | |||||
Labor | Mary Delahunty | 18,351 | 65.0 | −4.9 | |
Democrats | Kern Saunders | 9,891 | 35.0 | +35.0 | |
Labor hold | Swing | -4.9 | |||
Party | Candidate | Votes | % | ±% | |
---|---|---|---|---|---|
Labor | Tony Sheehan | 18,550 | 59.6 | +4.5 | |
Liberal | Alex Hay | 8,783 | 28.2 | +0.4 | |
Independent | Greg Barber | 2,421 | 7.8 | +7.8 | |
Independent | Jonathan Hogge | 823 | 2.6 | +2.6 | |
Natural Law | Michael Dickins | 554 | 1.8 | +0.2 | |
Total formal votes | 31,131 | 96.2 | +3.2 | ||
Informal votes | 1,238 | 3.8 | −3.2 | ||
Turnout | 32,369 | 92.8 | |||
Two-party-preferred result | |||||
Labor | Tony Sheehan | 21,646 | 69.9 | +4.7 | |
Liberal | Alex Hay | 9,336 | 30.1 | −4.7 | |
Labor hold | Swing | +4.7 | |||
Party | Candidate | Votes | % | ±% | |
---|---|---|---|---|---|
Labor | Tony Sheehan | 16,288 | 55.1 | −16.5 | |
Liberal | Nicholas Kotsiras | 8,212 | 27.8 | −0.6 | |
Independent | Carolyn Purdue | 2,337 | 7.9 | +7.9 | |
Independent | Frank Ryan | 1,228 | 4.2 | +4.2 | |
Natural Law | Michael Dickins | 473 | 1.6 | +1.6 | |
Independent | Joe Kenwright | 320 | 1.1 | +1.1 | |
Call to Australia | Ken Cook | 257 | 0.9 | +0.9 | |
Independent | John Graham | 236 | 0.8 | +0.8 | |
Independent | Dimitrios Karmis | 201 | 0.7 | +0.7 | |
Total formal votes | 29,552 | 93.0 | +0.1 | ||
Informal votes | 2,234 | 7.0 | −0.1 | ||
Turnout | 31,786 | 93.8 | |||
Two-party-preferred result | |||||
Labor | Tony Sheehan | 19,213 | 65.2 | −6.5 | |
Liberal | Nicholas Kotsiras | 10,271 | 34.8 | +6.5 | |
Labor hold | Swing | -6.5 | |||
Party | Candidate | Votes | % | ±% | |
---|---|---|---|---|---|
Labor | Tony Sheehan | 17,900 | 71.67 | −0.17 | |
Liberal | Ross Lane | 7,075 | 28.33 | +0.17 | |
Total formal votes | 24,975 | 93.10 | −2.41 | ||
Informal votes | 1,851 | 6.90 | +2.41 | ||
Turnout | 26,826 | 89.73 | −1.02 | ||
Labor hold | Swing | -0.17 | |||
Party | Candidate | Votes | % | ±% | |
---|---|---|---|---|---|
Labor | Frank Wilkes | 19,120 | 71.8 | −2.8 | |
Liberal | William Hamilton | 7,495 | 28.2 | +2.8 | |
Total formal votes | 26,615 | 95.5 | |||
Informal votes | 1,252 | 4.5 | |||
Turnout | 27,867 | 90.8 | |||
Labor hold | Swing | -2.8 | |||
Party | Candidate | Votes | % | ±% | |
---|---|---|---|---|---|
Labor | Frank Wilkes | 19,113 | 73.5 | +3.3 | |
Liberal | Gerard Clarke | 6,898 | 26.5 | −0.2 | |
Total formal votes | 26,011 | 95.5 | −0.4 | ||
Informal votes | 1,217 | 4.5 | +0.4 | ||
Turnout | 27,228 | 92.6 | +1.9 | ||
Labor hold | Swing | +1.6 | |||
Party | Candidate | Votes | % | ±% | |
---|---|---|---|---|---|
Labor | Frank Wilkes | 17,897 | 70.2 | +6.0 | |
Liberal | Lilian Heath | 6,821 | 26.7 | −9.1 | |
Independent | Ian Hughes | 793 | 3.1 | +3.1 | |
Total formal votes | 25,511 | 95.9 | −0.4 | ||
Informal votes | 1,103 | 4.1 | +0.4 | ||
Turnout | 26,614 | 90.7 | 0.0 | ||
Two-party-preferred result | |||||
Labor | Frank Wilkes | 18,336 | 71.9 | +7.7 | |
Liberal | Lilian Heath | 7,175 | 28.1 | −7.7 | |
Labor hold | Swing | +7.7 | |||
Party | Candidate | Votes | % | ±% | |
---|---|---|---|---|---|
Labor | Frank Wilkes | 16,809 | 64.2 | +5.8 | |
Liberal | Gillford Brown | 9,388 | 35.8 | +4.6 | |
Total formal votes | 26,197 | 96.3 | |||
Informal votes | 1,002 | 3.7 | |||
Turnout | 27,199 | 90.7 | |||
Labor hold | Swing | +4.3 | |||
Party | Candidate | Votes | % | ±% | |
---|---|---|---|---|---|
Labor | Frank Wilkes | 13,438 | 58.7 | −2.3 | |
Liberal | Michael Galli | 6,990 | 30.6 | +30.6 | |
Democratic Labor | Albert Dowsey | 2,448 | 10.7 | −28.3 | |
Total formal votes | 22,876 | 95.8 | +1.6 | ||
Informal votes | 1,013 | 4.2 | −1.6 | ||
Turnout | 23,889 | 93.4 | −0.4 | ||
Two-party-preferred result | |||||
Labor | Frank Wilkes | 13,805 | 60.3 | −0.7 | |
Liberal | Michael Galli | 9,071 | 39.7 | +0.7 | |
Labor hold | Swing | -0.7 | |||
Party | Candidate | Votes | % | ±% | |
---|---|---|---|---|---|
Labor | Frank Wilkes | 13,061 | 61.0 | +6.9 | |
Democratic Labor | Albert Dowsey | 8,338 | 39.0 | +23.2 | |
Total formal votes | 21,399 | 94.3 | −1.9 | ||
Informal votes | 1,287 | 5.7 | +1.9 | ||
Labor hold | Swing | +4.5 | |||
Party | Candidate | Votes | % | ±% | |
---|---|---|---|---|---|
Labor | Frank Wilkes | 12,121 | 54.1 | +0.7 | |
Liberal | Peter Falconer | 6,748 | 30.1 | −0.2 | |
Democratic Labor | John Little | 3,527 | 15.8 | −0.5 | |
Total formal votes | 22,396 | 96.2 | |||
Informal votes | 877 | 3.8 | |||
Turnout | 23,273 | 94.7 | |||
Two-party-preferred result | |||||
Labor | Frank Wilkes | 12,650 | 56.5 | +0.8 | |
Liberal | Peter Falconer | 9,746 | 43.5 | −0.8 | |
Labor hold | Swing | +0.8 | |||
Party | Candidate | Votes | % | ±% | |
---|---|---|---|---|---|
Labor | Frank Wilkes | 9,973 | 56.0 | −1.0 | |
Liberal and Country | Max Crellin | 4,772 | 26.8 | +8.7 | |
Democratic Labor | John Little | 3,061 | 17.2 | −7.7 | |
Total formal votes | 17,806 | 96.6 | −0.2 | ||
Informal votes | 617 | 3.4 | +0.2 | ||
Turnout | 18,423 | 94.7 | −0.2 | ||
Two-party-preferred result | |||||
Labor | Frank Wilkes | 10,432 | 58.6 | −2.1 | |
Liberal and Country | Max Crellin | 7,374 | 41.4 | +2.1 | |
Labor hold | Swing | -2.1 | |||
Party | Candidate | Votes | % | ±% | |
---|---|---|---|---|---|
Labor | Frank Wilkes | 10,551 | 57.0 | −2.9 | |
Democratic Labor | Thomas Walsh | 4,620 | 24.9 | +1.7 | |
Liberal and Country | Julian Sullivan | 3,349 | 18.1 | +1.1 | |
Total formal votes | 18,520 | 96.8 | −1.2 | ||
Informal votes | 614 | 3.2 | +1.2 | ||
Turnout | 19,134 | 94.9 | +0.9 | ||
Two-party-preferred result | |||||
Labor | Frank Wilkes | 11,244 | 60.7 | −2.6 | |
Liberal and Country | Julian Sullivan | 7,276 | 39.3 | +2.6 | |
Labor hold | Swing | -2.6 | |||
Party | Candidate | Votes | % | ±% | |
---|---|---|---|---|---|
Labor | Frank Wilkes | 11,980 | 59.9 | ||
Democratic Labor | Thomas Walsh | 4,631 | 23.1 | ||
Liberal and Country | Edward Wells | 3,394 | 17.0 | ||
Total formal votes | 20,005 | 98.0 | |||
Informal votes | 414 | 2.0 | |||
Turnout | 20,419 | 94.0 | |||
Two-candidate-preferred result | |||||
Labor | Frank Wilkes | 12,674 | 63.3 | ||
Democratic Labor | Thomas Walsh | 7,331 | 36.7 | ||
Labor hold | Swing | ||||
Party | Candidate | Votes | % | ±% | |
---|---|---|---|---|---|
Labor | Frank Wilkes | 8,347 | 56.6 | −4.3 | |
Liberal and Country | Frederick Capp | 3,243 | 22.0 | −0.6 | |
Democratic Labor | Thomas Walsh | 3,158 | 21.4 | +4.9 | |
Total formal votes | 14,748 | 98.1 | −0.2 | ||
Informal votes | 281 | 1.9 | +0.2 | ||
Turnout | 15,029 | 84.5 | −8.2 | ||
Labor hold | Swing | N/A | |||
Party | Candidate | Votes | % | ±% | |
---|---|---|---|---|---|
Labor | John Cain | 10,655 | 60.9 | ||
Liberal and Country | Neil McDay | 3,953 | 22.6 | ||
Labor (A-C) | David Woodhouse | 2,890 | 16.5 | ||
Total formal votes | 17,498 | 98.3 | |||
Informal votes | 294 | 1.7 | |||
Turnout | 17,792 | 92.7 | |||
Two-party-preferred result | |||||
Labor | John Cain | 11,089 | 63.4 | ||
Liberal and Country | Neil McDay | 6,409 | 36.6 | ||
Labor hold | Swing | ||||
Party | Candidate | Votes | % | ±% | |
---|---|---|---|---|---|
Labor | John Cain | Unopposed | |||
Labor hold | Swing | N/A | |||
Party | Candidate | Votes | % | ±% | |
---|---|---|---|---|---|
Labor | John Cain | 17,040 | 70.0 | +6.2 | |
Liberal and Country | Thomas Templeton | 7,301 | 30.0 | −6.2 | |
Total formal votes | 24,341 | 96.7 | +1.2 | ||
Informal votes | 171 | 0.7 | −1.2 | ||
Turnout | 24,512 | 96.7 | +1.2 | ||
Labor hold | Swing | +6.2 | |||
Party | Candidate | Votes | % | ±% | |
---|---|---|---|---|---|
Labor | John Cain | 15,618 | 63.8 | −36.2 | |
Liberal | Jack McColl | 8,853 | 36.2 | +36.2 | |
Total formal votes | 24,471 | 99.0 | |||
Informal votes | 248 | 1.0 | |||
Turnout | 24,719 | 95.5 | |||
Labor hold | Swing | N/A | |||
Party | Candidate | Votes | % | ±% | |
---|---|---|---|---|---|
Labor | John Cain | unopposed | |||
Labor hold | Swing | ||||
Party | Candidate | Votes | % | ±% | |
---|---|---|---|---|---|
Labor | John Cain | unopposed | |||
Labor hold | Swing | ||||
Party | Candidate | Votes | % | ±% | |
---|---|---|---|---|---|
Labor | John Cain | 17,184 | 74.4 | +3.0 | |
United Australia | Herbert Rasmussen | 5,902 | 25.6 | −3.0 | |
Total formal votes | 23,086 | 98.7 | −0.4 | ||
Informal votes | 304 | 1.3 | +0.4 | ||
Turnout | 23,390 | 94.7 | −0.1 | ||
Labor hold | Swing | +3.0 | |||
Party | Candidate | Votes | % | ±% | |
---|---|---|---|---|---|
Labor | John Cain | 16,513 | 71.4 | +3.7 | |
United Australia | Jonas Holt | 6,591 | 28.6 | −3.7 | |
Total formal votes | 23,104 | 99.1 | +0.7 | ||
Informal votes | 216 | 0.9 | −0.7 | ||
Turnout | 23,320 | 94.8 | −0.9 | ||
Labor hold | Swing | +3.7 | |||
Party | Candidate | Votes | % | ±% | |
---|---|---|---|---|---|
Labor | John Cain | 15,108 | 67.7 | +8.2 | |
United Australia | Fred Edmunds | 7,191 | 32.3 | −8.2 | |
Total formal votes | 22,299 | 98.4 | −0.5 | ||
Informal votes | 362 | 1.6 | +0.5 | ||
Turnout | 22,661 | 95.7 | +2.1 | ||
Labor hold | Swing | +8.2 | |||
Party | Candidate | Votes | % | ±% | |
---|---|---|---|---|---|
Labor | John Cain | 12,945 | 59.5 | −40.5 | |
United Australia | William Olver | 8,802 | 40.5 | +40.5 | |
Total formal votes | 21,747 | 98.9 | |||
Informal votes | 236 | 1.1 | |||
Turnout | 21,983 | 93.6 | |||
Labor hold | Swing | N/A | |||
Party | Candidate | Votes | % | ±% | |
---|---|---|---|---|---|
Labor | John Cain | unopposed | |||
Labor hold | Swing | ||||
Party | Candidate | Votes | % | ±% | |
---|---|---|---|---|---|
Labor | John Cain | unopposed | |||
Labor hold | Swing | ||||
The electoral district of Northcote is an electoral district of the Victorian Legislative Assembly. It covers the suburbs of Alphington, Fairfield, Northcote, Thornbury, and part of Preston. It lies on the northern bank of the Yarra River between the Merri and Darebin creeks.
In Australian politics, the two-party-preferred vote is the result of an election or opinion poll after preferences have been distributed to the highest two candidates, who in some cases can be independents. For the purposes of TPP, the Liberal/National Coalition is usually considered a single party, with Labor being the other major party. Typically the TPP is expressed as the percentages of votes attracted by each of the two major parties, e.g. "Coalition 50%, Labor 50%", where the values include both primary votes and preferences. The TPP is an indicator of how much swing has been attained/is required to change the result, taking into consideration preferences, which may have a significant effect on the result.
The 2010 Victorian state election, held on Saturday, 27 November 2010, was for the 57th Parliament of Victoria. The election was to elect all 88 members of the Legislative Assembly and all 40 members of the Legislative Council. The incumbent centre-left Labor Party government, led by John Brumby, was defeated by the centre-right Liberal/National Coalition opposition, led by Ted Baillieu. The election gave the Coalition a one-seat majority in both houses of parliament.
This is a list of electoral results for the Electoral district of Albert Park in Victorian state elections from 1889 to the present.
This is a list of electoral results for the Electoral district of Broadmeadows in Victorian state elections.
This is a list of electoral results for the Electoral district of Dandenong in Victorian state elections.
This is a list of electoral results for the Electoral district of Footscray in Victorian state elections.
This is a list of electoral results for the Electoral district of Melbourne in Victorian state elections.
This is a list of electoral results for the Electoral district of Preston in Victorian state elections.
This is a list of electoral results for the Electoral district of Richmond in Victorian state elections.
This is a list of electoral results for the Electoral district of Swan Hill in Victorian state elections.
This is a list of electoral results for the Electoral district of Williamstown in Victorian state elections.
A by-election was held for the Victorian Legislative Assembly seat of Melbourne on Saturday 21 July 2012. This was triggered by the resignation of former minister and state Labor MLA Bronwyn Pike which she announced on 7 May 2012.
A by-election for the seat of Lyndhurst in the Victorian Legislative Assembly was held on 27 April 2013. The by-election was triggered by the resignation of Labor Party (ALP) member Tim Holding on 18 February 2013. Martin Pakula retained the seat for Labor.
The 2018 Victorian state election was held on Saturday, 24 November 2018 to elect the 59th Parliament of Victoria. All 88 seats in the Legislative Assembly and all 40 seats in the Legislative Council were up for election. The first-term incumbent Labor government, led by Premier Daniel Andrews, won a second four-year term, defeating the Liberal/National Coalition opposition, led by Opposition Leader Matthew Guy in a landslide victory. Minor party the Greens led by Samantha Ratnam also contested the election.
A by-election for the seat of Gippsland South in the Victorian Legislative Assembly was held on 14 March 2015. The by-election was triggered by the resignation of former state National Party leader and Deputy Premier, Peter Ryan. Ryan had been a member of the Victorian parliament for over 22 years, and last retained the seat at the 2014 election on a 65.7 percent two-party vote, with a negative 6.9 percentage point swing. The election was contested on the same boundaries used at the previous state election.
A by-election for the seat of Northcote in the Victorian Legislative Assembly was held on 18 November 2017. The by-election was triggered by the death of Labor Party MP Fiona Richardson on 23 August 2017. While the seat historically has firmly been in the Labor Party's hands since its inception in 1927, environmental issues, rising house prices and demographic trends have resulted in a stronger Greens vote at recent elections. The Liberal Party elected not to field a candidate.
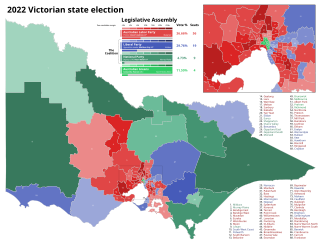
The 2022 Victorian state election was held on Saturday, 26 November 2022 to elect the 60th Parliament of Victoria. All 88 seats in the Legislative Assembly and all 40 seats in the Legislative Council were up for election at the time the writs were issued, however the election in the district of Narracan was deferred due to the death of a candidate.
The Australian Federation Party (AFP), also known as AusFeds and formerly known as the Country Alliance and the Australian Country Party, is an Australian political party. Founded in 2004 by four rural Victorians, the party lodged its initial registration with the Victorian Electoral Commission on 15 August 2005.
The 2026 Victorian state election is expected to be held on 28 November 2026 to elect the 61st Parliament of Victoria. All 88 seats in the Legislative Assembly and all 40 seats in the Legislative Council will be up for election, presuming there are no new electorates added in a redistribution.