This is a list of electoral results for the Electoral district of Carrum in Victorian state elections.
Member | Party | Term | |
---|---|---|---|
Ian Cathie | Labor | 1976–1988 | |
Mal Sandon | Labor | 1988–1996 | |
David Lean | Liberal | 1996–1999 | |
Jenny Lindell | Labor | 1999–2010 | |
Donna Bauer | Liberal | 2010–2014 | |
Sonya Kilkenny | Labor | 2014–present |
Party | Candidate | Votes | % | ±% | |
---|---|---|---|---|---|
Labor | Sonya Kilkenny | 21,586 | 49.9 | −3.1 | |
Liberal | Bec Buchanan | 13,141 | 30.3 | −2.3 | |
Greens | Jayde Lillico | 3,282 | 7.6 | +2.1 | |
Freedom | Georgia Erevnidis | 1,750 | 4.0 | +4.0 | |
Family First | Jeremy Cameron | 1,354 | 3.1 | +3.1 | |
Animal Justice | Taylor Macgregor Owen | 1,201 | 2.8 | +2.8 | |
Independent | Damian Willis | 986 | 2.3 | +2.3 | |
Total formal votes | 43,294 | 95.2 | +1.1 | ||
Informal votes | 2,183 | 4.8 | −1.1 | ||
Turnout | 45,477 | 88.7 | −1.7 | ||
Two-party-preferred result | |||||
Labor | Sonya Kilkenny | 25,871 | 59.8 | −2.2 | |
Liberal | Bec Buchanan | 17,423 | 40.2 | +2.2 | |
Labor hold | Swing | −2.2 |
Party | Candidate | Votes | % | ±% | |
---|---|---|---|---|---|
Labor | Sonya Kilkenny | 21,844 | 52.7 | +6.5 | |
Liberal | Donna Bauer | 13,608 | 32.9 | −9.3 | |
Greens | Braeden Thompson | 2,432 | 5.9 | −1.7 | |
Justice | Simone Philpott-Smart | 1,822 | 4.4 | +4.4 | |
Democratic Labor | Jennifer Bowden | 696 | 1.7 | +1.7 | |
Transport Matters | Santosh Kumar Yadav | 585 | 1.4 | +1.4 | |
Independent | Michael Tellesson | 433 | 1.1 | +1.1 | |
Total formal votes | 41,420 | 94.1 | −0.8 | ||
Informal votes | 2,618 | 5.9 | +0.8 | ||
Turnout | 44,038 | 90.4 | −2.8 | ||
Two-party-preferred result | |||||
Labor | Sonya Kilkenny | 25,660 | 62.0 | +11.3 | |
Liberal | Donna Bauer | 15,761 | 38.0 | −11.3 | |
Labor hold | Swing | +11.3 | |||
Party | Candidate | Votes | % | ±% | |
---|---|---|---|---|---|
Liberal | Donna Bauer | 17,802 | 45.2 | +1.6 | |
Labor | Sonya Kilkenny | 16,645 | 42.2 | +2.0 | |
Greens | Henry Kelsall | 2,989 | 7.6 | −1.6 | |
Family First | Richard Vernay | 1,281 | 3.2 | +0.6 | |
Rise Up Australia | Margaret Quinn | 708 | 1.8 | +1.8 | |
Total formal votes | 39,425 | 94.9 | +0.3 | ||
Informal votes | 2,126 | 5.1 | −0.3 | ||
Turnout | 41,551 | 93.2 | +2.9 | ||
Two-party-preferred result | |||||
Labor | Sonya Kilkenny | 19,998 | 50.7 | +1.0 | |
Liberal | Donna Bauer | 19,427 | 49.3 | −1.0 | |
Labor gain from Liberal | Swing | +1.0 | |||
Party | Candidate | Votes | % | ±% | |
---|---|---|---|---|---|
Liberal | Donna Bauer | 17,539 | 46.37 | +8.27 | |
Labor | Jenny Lindell | 14,430 | 38.15 | −9.77 | |
Greens | Henry Kelsall | 3,593 | 9.50 | +0.60 | |
Family First | John Churchwood | 939 | 2.48 | −1.10 | |
Democratic Labor | Ewa Losinski | 873 | 2.31 | +2.31 | |
Independent | Steven Garland | 447 | 1.18 | +1.18 | |
Total formal votes | 37,821 | 95.36 | +0.08 | ||
Informal votes | 1,840 | 4.64 | −0.08 | ||
Turnout | 39,661 | 93.51 | +0.14 | ||
Two-party-preferred result | |||||
Liberal | Donna Bauer | 19,765 | 52.21 | +8.90 | |
Labor | Jenny Lindell | 18,093 | 47.79 | −8.90 | |
Liberal gain from Labor | Swing | +8.90 | |||
Party | Candidate | Votes | % | ±% | |
---|---|---|---|---|---|
Labor | Jenny Lindell | 16,846 | 47.92 | −5.07 | |
Liberal | Jeff Shelley | 13,392 | 38.10 | +3.09 | |
Greens | Carlos Lopez | 3,128 | 8.90 | −1.61 | |
Family First | Michael McLean | 1,259 | 3.58 | +3.58 | |
Independent | Ronnie Musster | 270 | 0.77 | +0.77 | |
Independent | Alan Thompson | 259 | 0.74 | +0.74 | |
Total formal votes | 35,154 | 95.28 | −1.68 | ||
Informal votes | 1,741 | 4.72 | +1.68 | ||
Turnout | 36,895 | 93.37 | −0.04 | ||
Two-party-preferred result | |||||
Labor | Jenny Lindell | 19,968 | 56.69 | −5.47 | |
Liberal | Jeff Shelley | 15,256 | 43.31 | +5.47 | |
Labor hold | Swing | -5.47 | |||
Party | Candidate | Votes | % | ±% | |
---|---|---|---|---|---|
Labor | Jenny Lindell | 18,654 | 53.0 | +5.5 | |
Liberal | Ross MacInnes | 12,325 | 35.0 | −11.6 | |
Greens | Darren Bujeya | 3,700 | 10.5 | +4.9 | |
Independent | Michael Good | 525 | 1.5 | +1.5 | |
Total formal votes | 35,204 | 97.0 | −0.2 | ||
Informal votes | 1,103 | 3.0 | +0.2 | ||
Turnout | 36,307 | 93.4 | |||
Two-party-preferred result | |||||
Labor | Jenny Lindell | 21,873 | 62.2 | +10.5 | |
Liberal | Ross MacInnes | 13,315 | 37.8 | −10.5 | |
Labor hold | Swing | +10.5 | |||
Party | Candidate | Votes | % | ±% | |
---|---|---|---|---|---|
Liberal | David Lean | 16,770 | 48.2 | −1.1 | |
Labor | Jenny Lindell | 16,099 | 46.3 | +0.4 | |
Greens | Dan Bray | 1,896 | 5.5 | +5.5 | |
Total formal votes | 34,765 | 97.5 | −0.5 | ||
Informal votes | 899 | 2.5 | +0.5 | ||
Turnout | 35,664 | 93.5 | |||
Two-party-preferred result | |||||
Labor | Jenny Lindell | 17,444 | 50.2 | +1.0 | |
Liberal | David Lean | 17,321 | 49.8 | −1.0 | |
Labor gain from Liberal | Swing | +1.0 | |||
Party | Candidate | Votes | % | ±% | |
---|---|---|---|---|---|
Liberal | David Lean | 16,248 | 49.3 | +2.6 | |
Labor | Mal Sandon | 15,123 | 45.9 | +1.3 | |
Independent | Keith Edwards | 931 | 2.8 | +2.8 | |
Natural Law | Bev Brain | 632 | 1.9 | −1.1 | |
Total formal votes | 32,934 | 98.0 | +1.7 | ||
Informal votes | 670 | 2.0 | −1.7 | ||
Turnout | 33,604 | 94.2 | |||
Two-party-preferred result | |||||
Liberal | David Lean | 16,703 | 50.8 | +1.7 | |
Labor | Mal Sandon | 16,189 | 49.2 | −1.7 | |
Liberal gain from Labor | Swing | +1.7 | |||
Party | Candidate | Votes | % | ±% | |
---|---|---|---|---|---|
Liberal | John Robinson | 14,374 | 46.7 | +4.2 | |
Labor | Mal Sandon | 13,708 | 44.6 | −11.2 | |
Independent | Merran Jones | 1,046 | 3.4 | +3.4 | |
Natural Law | Bev Nelson | 931 | 3.0 | +3.0 | |
Independent | Mark Dunn | 478 | 1.6 | +1.6 | |
Independent | Mark Williams | 213 | 0.7 | +0.7 | |
Total formal votes | 30,750 | 96.4 | +0.0 | ||
Informal votes | 1,163 | 3.6 | −0.0 | ||
Turnout | 31,913 | 95.4 | |||
Two-party-preferred result | |||||
Labor | Mal Sandon | 15,598 | 50.9 | −5.7 | |
Liberal | John Robinson | 15,058 | 49.1 | +5.7 | |
Labor hold | Swing | -5.7 | |||
Party | Candidate | Votes | % | ±% | |
---|---|---|---|---|---|
Labor | Mal Sandon | 15,308 | 57.49 | −1.94 | |
Liberal | Marie McIntosh | 11,320 | 42.51 | +1.94 | |
Total formal votes | 26,628 | 95.94 | −1.29 | ||
Informal votes | 1,127 | 4.06 | +1.29 | ||
Turnout | 27,755 | 91.64 | −1.47 | ||
Labor hold | Swing | -1.94 | |||
Party | Candidate | Votes | % | ±% | |
---|---|---|---|---|---|
Labor | Ian Cathie | 15,440 | 59.4 | +0.5 | |
Liberal | Bruce Bowie | 10,540 | 40.6 | +2.3 | |
Total formal votes | 25,980 | 97.2 | |||
Informal votes | 740 | 2.8 | |||
Turnout | 26,720 | 93.1 | |||
Labor hold | Swing | -1.5 | |||
Party | Candidate | Votes | % | ±% | |
---|---|---|---|---|---|
Labor | Ian Cathie | 17,786 | 62.7 | +7.2 | |
Liberal | Derek Bunyan | 9,599 | 33.8 | −1.3 | |
Democrats | William Towers | 999 | 3.5 | −5.0 | |
Total formal votes | 28,384 | 97.0 | −0.3 | ||
Informal votes | 837 | 3.0 | +0.3 | ||
Turnout | 29,221 | 93.2 | 0.0 | ||
Two-party-preferred result | |||||
Labor | Ian Cathie | 18,360 | 64.7 | +2.8 | |
Liberal | Derek Bunyan | 10,024 | 35.3 | −2.8 | |
Labor hold | Swing | +2.8 | |||
Party | Candidate | Votes | % | ±% | |
---|---|---|---|---|---|
Labor | Ian Cathie | 15,198 | 55.5 | +0.5 | |
Liberal | Hugh Falconer | 9,613 | 35.1 | −9.9 | |
Democrats | Wendy Kleeman | 2,321 | 8.5 | +8.5 | |
Australia | Brenda Heath | 250 | 0.9 | +0.9 | |
Total formal votes | 27,382 | 97.3 | +0.1 | ||
Informal votes | 750 | 2.7 | −0.1 | ||
Turnout | 28,132 | 93.2 | +1.2 | ||
Two-party-preferred result | |||||
Labor | Ian Cathie | 16,936 | 61.9 | +6.9 | |
Liberal | Hugh Falconer | 10,446 | 38.1 | −6.9 | |
Labor hold | Swing | +6.9 | |||
Party | Candidate | Votes | % | ±% | |
---|---|---|---|---|---|
Labor | Ian Cathie | 14,137 | 55.0 | +3.7 | |
Liberal | Allan Coombes | 11,572 | 45.0 | +5.4 | |
Total formal votes | 25,709 | 97.2 | |||
Informal votes | 731 | 2.8 | |||
Turnout | 26,440 | 92.0 | |||
Labor hold | Swing | +1.1 | |||
The electoral district of Carrum is an electoral district of the Victorian Legislative Assembly. It lies in the south eastern suburbs of Melbourne, covering Bangholme, Bonbeach, Carrum, Carrum Downs, Patterson Lakes, Sandhurst, Seaford and Skye.
The electoral district of Brighton is an electoral district of the Victorian Legislative Assembly. It covers an area of 20 square kilometres (7.7 sq mi) in south-eastern Melbourne, including the suburbs of Brighton and Elwood, and parts of Brighton East and Hampton. It lies within the Southern Metropolitan Region of the upper house, the Legislative Council.
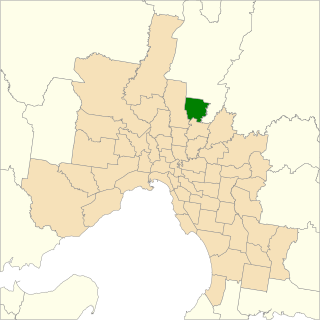
The electoral district of Mill Park is an electoral district of the Victorian Legislative Assembly.
The electoral district of Berwick is an electoral district of the Legislative Assembly in the Australian state of Victoria.
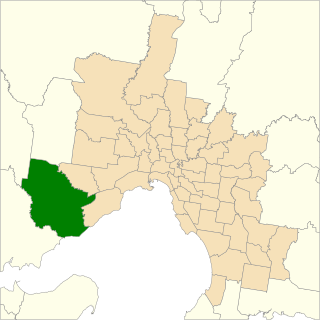
The electoral district of Werribee is an electoral district of the Legislative Assembly in the Australian state of Victoria. It has existed in two incarnations, first from 1976 to 2002, and was created again in the 2013 redistribution and came into effect at the 2014 state election.
This is a list of electoral results for the district of Brighton in Victorian state elections.
This is a list of electoral results for the district of Mulgrave in Victorian state elections.
This is a list of electoral results for the Electoral district of Narre Warren North in Victorian state elections.
This is a list of electoral results for the Electoral district of Nepean in Victorian state elections.
This is a list of electoral results for the Electoral district of Tarneit in Victorian state elections.
This is a list of electoral results for the Electoral district of Warrandyte in Victorian state elections.
This is a list of electoral results for the district of Yan Yean in Victorian state elections.
This is a list of electoral results for the electoral district of Berwick in Victorian state elections.
The electoral district of Murray Plains is an electoral district of the Victorian Legislative Assembly in Australia. It was created in the redistribution of electoral boundaries in 2013, and came into effect at the 2014 state election.
The electoral district of Sunbury is an electoral district of the Victorian Legislative Assembly in Australia. It was created in the redistribution of electoral boundaries in 2013, and came into effect at the 2014 state election.
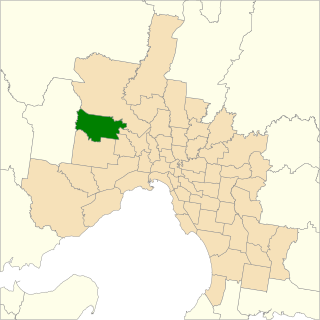
The electoral district of Sydenham is an electoral district of the Victorian Legislative Assembly in Australia. It was created in the redistribution of electoral boundaries in 2013, and came into effect at the 2014 state election.
The Electoral district of Laverton is an electoral district of the Victorian Legislative Assembly in Australia. It was created in the redistribution of electoral boundaries in 2021, and came into effect at the 2022 Victorian state election.
The electoral district of Greenvale is an electoral district of the Victorian Legislative Assembly in Australia. It was created in the redistribution of electoral boundaries in 2021, and came into effect at the 2022 Victorian state election.
The Electoral district of Kalkallo is an electoral district of the Victorian Legislative Assembly in Australia. It was created in the redistribution of electoral boundaries in 2021, and came into effect at the 2022 Victorian state election.
This is a list of electoral district results for the 2022 Victorian state election for the Legislative Assembly.