Electoral results for the district of Benambra

Last updated

This is a list of electoral results for the Electoral district of Benambra in Victorian state elections.

Contents

Members for Benambra

MemberPartyTerm
  Peter Wright Liberal1877–1880
  Peter Wallace Conservative1880–1886
  Peter Wright Liberal1886–1889
  Albert Craven Conservative1889–1913
 Conservative Liberal
  Comm Liberal
  John Leckie Comm Liberal 1913–1917
  Henry Beardmore Economy1917–1918
  Nationalist 1917–1931
  United Australia 1931–1932
  Roy Paton Country 1932–1947
  Thomas Mitchell Country 1947–1976
  National
  Lou Lieberman Liberal 1976–1992
  Tony Plowman Liberal 1992–2006
  Bill Tilley Liberal 2006–present

Election results

Elections in the 2020s

2022 Victorian state election: Benambra [1] [2]
PartyCandidateVotes%±%
Liberal Bill Tilley 17,65842.9+2.8
Independent Jacqui Hawkins13,03831.7+15.6
Labor Mark Tait5,37513.1−4.6
Greens Luke Brady1,5923.9+0.4
Animal Justice Mike Fuery1,1702.8+2.8
Family First Janelle Stratton8152.0+2.0
Liberal Democrats Dean Rossiter8042.0+2.0
Freedom Adrian James O'Brien6831.7+1.7
Total formal votes41,13595.1+0.5
Informal votes2,0994.9−0.5
Turnout 43,23486.4+0.5
Two-party-preferred result
Liberal Bill Tilley 26,02163.3+3.9
Labor Mark Tait15,11436.7−3.9
Two-candidate-preferred result
Liberal Bill Tilley 20,95650.9−1.7
Independent Jacqui Hawkins20,17949.1+1.7
Liberal hold Swing −1.7

Elections in the 2010s

2018 Victorian state election: Benambra [3]
PartyCandidateVotes%±%
Liberal Bill Tilley 16,51539.86−14.75
Labor Mark Tait7,46718.02−13.25
Independent Jacqui Hawkins6,68716.14+16.14
Independent Jenny O'Connor5,42713.10+13.10
Shooters, Fishers, Farmers Josh Knight3,7749.11+9.11
Greens John Bardsley1,5653.78−5.31
Total formal votes41,43594.66−0.80
Informal votes2,3365.34+0.80
Turnout 43,77189.70−3.17
Two-party-preferred result
Liberal Bill Tilley 24,39358.91−0.76
Labor Mark Tait17,01341.09+0.76
Two-candidate-preferred result
Liberal Bill Tilley 21,73252.45−7.23
Independent Jacqui Hawkins19,70347.55+47.55
Liberal hold Swing N/A
2014 Victorian state election: Benambra
PartyCandidateVotes%±%
Liberal Bill Tilley 21,43054.6+6.0
Labor Jennifer Podesta12,27331.3+7.7
Greens Richard Wellard3,5689.1−1.7
Country Alliance Philip Rourke1,9735.0−1.9
Total formal votes39,24495.5−0.3
Informal votes1,8634.5+0.3
Turnout 41,10792.9+0.7
Two-party-preferred result
Liberal Bill Tilley 23,45259.7−6.3
Labor Jennifer Podesta15,84840.3+6.3
Liberal hold Swing −6.3
2010 Victorian state election: Benambra
PartyCandidateVotes%±%
Liberal Bill Tilley 18,42455.86+17.24
Labor John Williams7,53722.85-10.12
Greens Jennifer O'Connor3,65811.09+4.38
Country Alliance Haden Macaulay2,2416.79+6.79
Family First Robert Cavedon1,1253.41+0.73
Total formal votes32,98595.80−0.87
Informal votes1,4474.20+0.87
Turnout 34,43292.45+0.17
Two-party-preferred result
Liberal Bill Tilley 21,90966.48+8.77
Labor John Williams11,04533.52-8.77
Liberal hold Swing +8.77

Elections in the 2000s

2006 Victorian state election: Benambra
PartyCandidateVotes%±%
Liberal Bill Tilley 12,13538.6-1.5
Labor Lisa Mahood10,35833.0-5.1
National Bill Baxter 5,68018.1+5.5
Greens Helen Judith Robinson2,1096.7-0.3
Family First Martin Corboy8422.7+2.7
Independent Shane Pearce2960.9+0.9
Total formal votes31,42096.7+0.2
Informal votes1,0833.3-0.2
Turnout 32,50392.3
Two-party-preferred result
Liberal Bill Tilley 18,13257.7+3.7
Labor Lisa Mahood13,28842.3-3.7
Liberal hold Swing +3.7
2002 Victorian state election: Benambra
PartyCandidateVotes%±%
Liberal Tony Plowman 12,17940.1-17.4
Labor Barb Murdoch11,55838.1-4.4
National Geoff Reid3,81812.6+12.6
Greens Helen Lucas2,1117.0+7.0
Christian Democrats Hannah Seymour6842.3+2.3
Total formal votes30,35096.4-0.6
Informal votes1,1193.6+0.6
Turnout 31,46992.2+0.3
Two-party-preferred result
Liberal Tony Plowman 16,39754.0-3.5
Labor Barb Murdoch13,95346.0+3.5
Liberal hold Swing -3.5

Elections in the 1990s

1999 Victorian state election: Benambra
PartyCandidateVotes%±%
Liberal Tony Plowman 18,01657.1-7.8
Labor Barb Murdoch13,56142.9+7.8
Total formal votes31,57797.1-0.9
Informal votes9312.9+0.9
Turnout 32,50891.9-1.4
Liberal hold Swing -7.8
1996 Victorian state election: Benambra
PartyCandidateVotes%±%
Liberal Tony Plowman 19,45262.9+18.5
Labor Michael Deuis10,23433.1+4.4
Natural Law Roslyn Johnson1,2614.1+4.1
Total formal votes30,94798.0+1.1
Informal votes6272.0-1.1
Turnout 31,57493.3-1.0
Two-party-preferred result
Liberal Tony Plowman 20,08564.9+0.2
Labor Michael Deuis10,85935.1-0.2
Liberal hold Swing +0.2
1992 Victorian state election: Benambra
PartyCandidateVotes%±%
Liberal Tony Plowman 12,73744.3-11.5
Labor Phil Burrows8,25128.7+2.5
Independent Nelson McIntosh5,10517.8+17.8
Independent Kevin Smith1,7606.1+6.1
Independent Rosslyn Murtagh8933.1+3.1
Total formal votes28,74696.9-0.7
Informal votes9243.1+0.7
Turnout 29,67094.3
Two-party-preferred result
Liberal Tony Plowman 18,57264.7-7.1
Labor Phil Burrows10,11335.3+7.1
Liberal hold Swing -7.1

Elections in the 1980s

1988 Victorian state election: Benambra
PartyCandidateVotes%±%
Liberal Lou Lieberman 16,42456.54-13.02
Labor Julie Nelson7,67026.40-4.04
National Judith Brewer4,95517.06+17.06
Total formal votes29,04997.66-0.38
Informal votes6962.34+0.38
Turnout 29,74590.87-0.38
Two-party-preferred result
Liberal Lou Lieberman 20,78871.59+2.03
Labor Julie Nelson8,25028.41-2.03
Liberal hold Swing +2.03
1985 Victorian state election: Benambra
PartyCandidateVotes%±%
Liberal Lou Lieberman 18,52569.6+11.3
Labor Virginia Coghill8,10530.4-2.0
Total formal votes26,63098.0
Informal votes5332.0
Turnout 27,16391.3
Liberal hold Swing +3.1
1982 Victorian state election: Benambra
PartyCandidateVotes%±%
Liberal Lou Lieberman 15,41356.7+4.2
Labor Joe Murphy8,67932.0+7.8
National Charles Ross3,07111.3-8.2
Total formal votes27,16397.7+0.3
Informal votes6432.3-0.3
Turnout 27,80692.2-0.7
Two-party-preferred result
Liberal Lou Lieberman 18,17766.9-2.2
Labor Joe Murphy8,98633.1+2.2
Liberal hold Swing -2.2

Elections in the 1970s

1979 Victorian state election: Benambra
PartyCandidateVotes%±%
Liberal Lou Lieberman 13,38252.5+26.5
Labor Max Edgar6,16424.2+0.2
National John Bidgood4,96619.5-17.1
Independent Dudley Schubert9593.8+3.8
Total formal votes25,50197.3-0.5
Informal votes6932.7+0.5
Turnout 26,16492.9+0.3
Two-party-preferred result
Liberal Lou Lieberman 17,62669.1-0.7
Labor Max Edgar7,87530.9+0.7
Liberal hold Swing -0.7
1976 Victorian state election: Benambra
PartyCandidateVotes%±%
National Bill Baxter 8,58136.6-6.2
Liberal Lou Lieberman 6,10726.0+4.0
Labor Ken Coghill 5,63224.0-3.9
Independent Robert Wiltshire2,72911.6+11.6
Democratic Labor Kevin Redfern4201.8-5.4
Total formal votes23,46997.8
Informal votes5302.2
Turnout 23,99992.6
Two-candidate-preferred result
Liberal Lou Lieberman 12,16751.8+51.8
National Bill Baxter 11,30248.2-21.7
Liberal gain from National Swing N/A
1973 Victorian state election: Benambra
PartyCandidateVotes%±%
Country Tom Mitchell 9,46249.4+2.1
Labor Ian Thomas5,52528.8+3.7
Liberal Henry Petty2,74814.3+3.7
Democratic Labor James Osmotherly1,4357.5-2.8
Total formal votes19,17097.3+1.0
Informal votes5282.7-1.0
Turnout 19,69894.4-0.7
Two-party-preferred result
Country Tom Mitchell 13,30569.4-1.4
Labor Ian Thomas5,86530.6+1.4
Country hold Swing -1.4
1970 Victorian state election: Benambra
PartyCandidateVotes%±%
Country Tom Mitchell 8,23347.3-7.4
Labor Edwin Ure4,36525.1+5.0
Liberal Robert Prior1,84910.6-2.0
Democratic Labor Francis Keenan1,80310.4-2.2
Independent John Hicks1,1646.7+6.7
Total formal votes17,41496.3-1.1
Informal votes6633.7+1.1
Turnout 18,07795.1-0.3
Two-party-preferred result
Country Tom Mitchell 12,33470.8-6.0
Labor Edwin Ure5,08029.2+6.0
Country hold Swing -6.0

Elections in the 1960s

1967 Victorian state election: Benambra
PartyCandidateVotes%±%
Country Tom Mitchell 9,44054.7+4.9
Labor Anthony Lamb3,46920.1-2.1
Liberal Henry Petty2,17712.6-2.0
Democratic Labor Francis Keenan2,16912.6-0.8
Total formal votes17,25597.4
Informal votes4672.6
Turnout 17,72295.4
Two-party-preferred result
Country Tom Mitchell 13,24276.8+1.6
Labor Anthony Lamb4,01323.2-1.6
Country hold Swing +1.6
1964 Victorian state election: Benambra
PartyCandidateVotes%±%
Country Tom Mitchell 11,14050.4-0.3
Labor Edwin Ure4,64621.0-2.0
Democratic Labor John Drummond3,22814.6-1.5
Liberal and Country Ronald Pretty3,10114.0+3.8
Total formal votes22,11597.9-0.1
Informal votes4782.1+0.1
Turnout 22,59394.6-0.1
Two-party-preferred result
Country Tom Mitchell 16,67775.4+1.8
Labor Edwin Ure5,43824.6-1.8
Country hold Swing +1.8
1961 Victorian state election: Benambra
PartyCandidateVotes%±%
Country Tom Mitchell 10,83550.7+0.6
Labor Reginald Mortimer4,92023.0+2.3
Democratic Labor William Findlay3,44516.10.0
Liberal and Country Robert Kilpatrick2,17110.2-2.8
Total formal votes21,37198.0-0.7
Informal votes4352.0+0.7
Turnout 21,80694.7+0.5
Two-party-preferred result
Country Tom Mitchell 15,71873.6-2.0
Labor Reginald Mortimer5,65326.4+2.0
Country hold Swing -2.0

Elections in the 1950s

1958 Victorian state election: Benambra
PartyCandidateVotes%±%
Country Tom Mitchell 10,08750.1
Labor Francis Taylor4,17220.7
Democratic Labor Henry Richards3,24716.1
Liberal and Country James Shannon2,61213.0
Total formal votes20,11898.7
Informal votes2581.3
Turnout 20,37694.2
Two-party-preferred result
Country Tom Mitchell 15,19775.6
Labor Francis Taylor4,92124.4
Country hold Swing
1955 Victorian state election: Benambra
PartyCandidateVotes%±%
Country Tom Mitchell 7,59540.3
Liberal and Country Norman Attree4,73425.1
Labor (A-C) William Findlay4,14022.0
Independent James Prendergast2,38312.7
Total formal votes18,85298.3
Informal votes3291.7
Turnout 19,18193.9
Two-candidate-preferred result
Country Tom Mitchell 9,80352.0
Liberal and Country Norman Attree9,04948.0
Country hold Swing
1952 Victorian state election: Benambra
PartyCandidateVotes%±%
Country Tom Mitchell 7,24157.3-16.7
Labor Geoffrey Holland5,38642.7+42.7
Total formal votes12,62798.9+1.0
Informal votes1391.1-1.0
Turnout 12,76690.9-1.3
Country hold Swing N/A
1950 Victorian state election: Benambra
PartyCandidateVotes%±%
Country Tom Mitchell 9,05074.0-26.0
Liberal and Country James Ronan3,18726.0+26.0
Total formal votes12,23797.9
Informal votes2642.1
Turnout 12,50192.2
Country hold Swing N/A

Elections in the 1940s

1947 Victorian state election: Benambra
PartyCandidateVotes%±%
Country Tom Mitchell unopposed
Country hold Swing N/A
1947 Benambra state by-election
PartyCandidateVotes%±%
Country Tom Mitchell 6,47758.6+1.9
Labor Frank Andrews4,56941.4-1.9
Total formal votes11,04699.5+0.2
Informal votes540.5-0.2
Turnout 11,10088.4+2.5
Country hold Swing +1.9
1945 Victorian state election: Benambra
PartyCandidateVotes%±%
Country Roy Paton 5,94956.7
Labor Charles Pollard4,53743.3
Total formal votes10,48699.3
Informal votes780.7
Turnout 10,56485.9
Country hold Swing
1943 Victorian state election: Benambra
PartyCandidateVotes%±%
Country Roy Paton 5,48168.9-31.1
Independent Francis Andrews2,47031.1+31.1
Total formal votes7,95198.7
Informal votes1021.3
Turnout 8,05384.7
Country hold Swing N/A
1940 Victorian state election: Benambra
PartyCandidateVotes%±%
Country Roy Paton unopposed
Country hold Swing

Elections in the 1930s

1937 Victorian state election: Benambra
PartyCandidateVotes%±%
Country Roy Paton 5,07260.4+7.6
United Australia Thomas Mitchell3,32939.6-7.6
Total formal votes8,40199.3+0.9
Informal votes610.7-0.9
Turnout 8,46294.5+0.8
Country hold Swing +7.6
1935 Victorian state election: Benambra
PartyCandidateVotes%±%
Country Roy Paton 4,39752.8+52.8
United Australia Tom Mitchell 3,92847.2-52.8
Total formal votes8,32598.4
Informal votes1331.6
Turnout 8,45893.7
Country hold Swing N/A
1932 Benambra state by-election
PartyCandidateVotes%±%
Labor John McKenzie-McHarg2,97736.4
Country Roy Paton 2,63532.2
United Australia Andrew Harris2,56731.4
Total formal votes8,17999.2
Informal votes660.8
Turnout 8,24586.6
Two-party-preferred result
Country Roy Paton 4,95660.6
Labor John McKenzie-McHarg3,22339.4
Country gain from United Australia Swing N/A
1932 Victorian state election: Benambra
PartyCandidateVotes%±%
United Australia Henry Beardmore unopposed
United Australia hold Swing

Elections in the 1920s

1929 Victorian state election: Benambra
PartyCandidateVotes%±%
Nationalist Henry Beardmore unopposed
Nationalist hold Swing N/A
1927 Victorian state election: Benambra
PartyCandidateVotes%±%
Nationalist Henry Beardmore unopposed
Nationalist hold Swing
1924 Victorian state election: Benambra
PartyCandidateVotes%±%
Nationalist Henry Beardmore 2,71474.8-25.2
Country John Hall 91425.2+25.2
Total formal votes3,62799.3
Informal votes270.7
Turnout 3,65454.5
Nationalist hold Swing N/A
1921 Victorian state election: Benambra
PartyCandidateVotes%±%
Nationalist Henry Beardmore unopposed
Nationalist hold Swing
1920 Victorian state election: Benambra
PartyCandidateVotes%±%
Nationalist Henry Beardmore 2,92886.5+37.5
Ind. Nationalist Edward Clutterbuck45513.5+13.5
Total formal votes3,38391.4-5.2
Informal votes3208.6+5.2
Turnout 3,70356.0+4.8
Nationalist hold Swing N/A

Elections in the 1910s

1917 Victorian state election: Benambra
PartyCandidateVotes%±%
Nationalist Henry Beardmore 1,62649.0
Nationalist Leslie Sambell1,06532.1
Nationalist George Jephcott63019.0
Total formal votes3,32196.6-1.6
Informal votes1163.4+1.6
Turnout 3,43751.2-10.4
Two-candidate-preferred result
Nationalist Henry Beardmore 2,10063.2
Nationalist Leslie Sambell1,22136.8
Nationalist hold Swing N/A
1917 Benambra state by-election
PartyCandidateVotes%±%
Nationalist Leslie Sambell1,11734.0N/A
Nationalist David Langlands75222.9N/A
Nationalist Henry Beardmore 71521.8N/A
Nationalist George Jephcott70521.5N/A
Total formal votes3,28997.1-1.1
Informal votes982.9+1.1
Turnout 3,38747.3-14.3
Two-candidate-preferred result
Nationalist Henry Beardmore 1,77954.1
Nationalist Leslie Sambell1,50645.9
Nationalist hold Swing N/A
1914 Victorian state election: Benambra
PartyCandidateVotes%±%
Liberal John Leckie 2,18350.2-11.9
Labor John Ross1,66838.3+0.5
Independent Jorgen Petersen50011.5+11.5
Total formal votes4,35198.20.0
Informal votes821.80.0
Turnout 4,43361.6-7.5
Two-party-preferred result
Liberal John Leckie 60.6-1.5
Labor John Ross39.4+1.5
Liberal hold Swing -1.5
1911 Victorian state election: Benambra
PartyCandidateVotes%±%
Liberal Albert Craven 2,79062.1+3.2
Labor Abraham Wright1,69937.8-3.2
Total formal votes4,48998.2-1.4
Informal votes821.8+1.4
Turnout 4,57169.1+12.3
Liberal hold Swing +3.2

Related Research Articles

<span class="mw-page-title-main">Electoral district of Benambra</span> State electoral district of Victoria, Australia

The electoral district of Benambra is one of the electoral districts of Victoria, Australia, for the Victorian Legislative Assembly. It covers an area of 10,037 square kilometres (3,875 sq mi) in north-eastern Victoria. The largest settlement is the city of Wodonga. Benambra also includes the towns of Baranduda, Barnawartha, Beechworth, Chiltern, Corryong, Eskdale, Kiewa, Mitta Mitta, Mount Beauty, Rutherglen, Tallangatta, Tangambalanga, Tawonga, Wahgunyah, and Yackandandah. It lies in the Northern Victoria Region of the upper house, the Legislative Council.

<span class="mw-page-title-main">Electoral district of Polwarth</span> State electoral district of Victoria, Australia

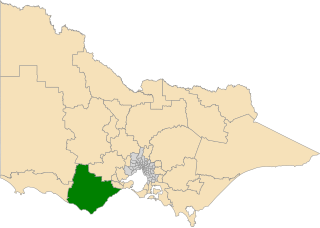
The electoral district of Polwarth is an electoral district of the Victorian Legislative Assembly. It is located in south-west rural Victoria, west of Geelong, and covers the Colac and Corangamite local government areas (LGA), parts of the Moyne, Golden Plains and Surf Coast LGAs, and slivers of the Ararat and Greater Geelong LGAs, running along the Great Ocean Road taking in Anglesea, Cape Otway, Peterborough, Aireys Inlet, Lorne, Wye River, Apollo Bay and Port Campbell, covering the inland towns of Winchelsea, Colac, Camperdown and Terang along the Princes Highway, and Inverleigh, Cressy, Lismore and Mortlake on the Hamilton Highway, and finally, includes the Otway Ranges and Lake Corangamite.

<span class="mw-page-title-main">Electoral district of Kew</span>

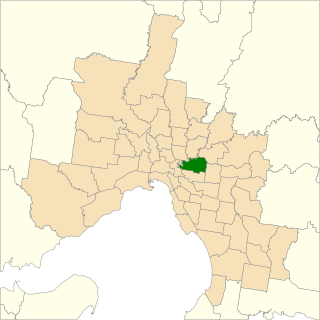
The electoral district of Kew is an electoral district of the Victorian Legislative Assembly. Located in eastern Melbourne, a few kilometres from the city centre, it is centred on the suburbs of Kew and Kew East. It also contains Balwyn, Balwyn North, Deepdene, and parts of Canterbury, Mont Albert, and Surrey Hills.

<span class="mw-page-title-main">Electoral district of Geelong</span>

The electoral district of Geelong is an electoral district of the Victorian Legislative Assembly. It centres on inner metropolitan Geelong and following the June 2013 redistribution of electoral boundaries includes the suburbs of Belmont, Breakwater, East Geelong, Geelong, Geelong West, Newtown and South Geelong, Herne Hill, Manifold Heights, Newcomb, Newtown, St Albans Park, Thomson, Whittington and part of Fyansford.

<span class="mw-page-title-main">Northern Victoria Region</span> Electoral region of the Victorian Legislative Council

Northern Victoria Region is one of the eight electoral regions of Victoria, Australia, which elects five members to the Victorian Legislative Council by proportional representation. The region was created in 2006 following the 2005 reform of the Victorian Legislative Council.

<span class="mw-page-title-main">Electoral district of Berwick</span>

The electoral district of Berwick is an electoral district of the Legislative Assembly in the Australian state of Victoria.

This is a list of electoral results for the Electoral district of Cranbourne in Victorian state elections.

This is a list of electoral results for the Electoral district of Mordialloc in Victorian state elections.

This is a list of electoral results for the Electoral district of Niddrie in Victorian state elections.

This is a list of electoral results for the Electoral district of Polwarth in Victorian state elections.

The 1927 Victorian state election was held in the Australian state of Victoria on Saturday, 9 April 1927, to elect the 65 members of the state's Legislative Assembly.

<span class="mw-page-title-main">Electoral district of Ringwood (Victoria)</span> State electoral district of Victoria, Australia

The electoral district of Ringwood is an electoral district of the Victorian Legislative Assembly, located in the east of Melbourne. It was first proclaimed in 1958 and was abolished in 1992. Some of Ringwood was included in the new electoral district of Bayswater that year. Kay Setches, the last member for Ringwood, contested and lost Bayswater at the 1992 election.

<span class="mw-page-title-main">Electoral district of Croydon (Victoria)</span> State electoral district of Victoria, Australia

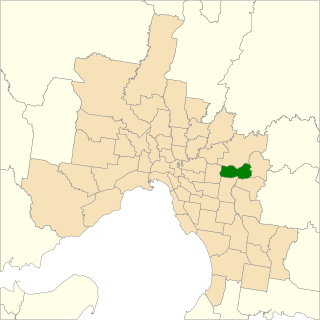
The electoral district of Croydon is an electoral district of the Victorian Legislative Assembly in Australia. It was created in the redistribution of electoral boundaries in 2013, and came into effect at the 2014 state election.

<span class="mw-page-title-main">Electoral district of Sunbury</span> State electoral district of Victoria, Australia

The electoral district of Sunbury is an electoral district of the Victorian Legislative Assembly in Australia. It was created in the redistribution of electoral boundaries in 2013, and came into effect at the 2014 state election.

<span class="mw-page-title-main">Electoral district of Sydenham</span> State electoral district of Victoria, Australia

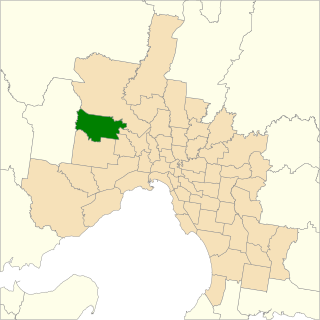
The electoral district of Sydenham is an electoral district of the Victorian Legislative Assembly in Australia. It was created in the redistribution of electoral boundaries in 2013, and came into effect at the 2014 state election.

This is a list of electoral results for the Electoral district of Ringwood in Victorian state elections.

This is a list of electoral results for the Electoral district of Rowville in Victorian state elections.

This is a list of electoral results for the Electoral district of St Albans in Victorian state elections.

This is a list of electoral results for the Electoral district of Sydenham in Victorian state elections.

This is a list of electoral district results for the 2022 Victorian state election for the Legislative Assembly.

References

  1. VIC 2021 Final Redistribution, ABC News. Retrieved 1 January 2023.
  2. Benambra District results, Victorian Electoral Commission. Retrieved 1 December 2022.
  3. State Election 2018: Benambra District, VEC.