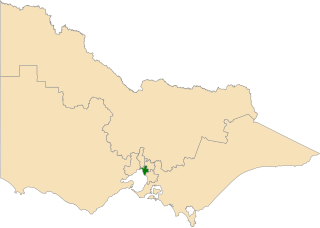
This is a list of electoral results for the Electoral district of Oakleigh in Victorian state elections.
Member | Party | Term | |
---|---|---|---|
Squire Reid | Labor | 1927–1932 | |
James Vinton Smith | United Australia | 1932–1937 | |
Squire Reid | Labor | 1937–1947 | |
John Lechte | Liberal | 1947–1950 | |
Val Doube | Labor | 1950–1961 | |
Alan Scanlan | Liberal | 1961–1979 | |
Race Mathews | Labor | 1979–1992 | |
Denise McGill | Liberal | 1992–1999 | |
Ann Barker | Labor | 1999–2014 | |
Steve Dimopoulos | Labor | 2014–present |
Party | Candidate | Votes | % | ±% | |
---|---|---|---|---|---|
Labor | Steve Dimopoulos | 19,778 | 45.0 | −8.3 | |
Liberal | Jim Grivokostopoulos | 12,848 | 29.3 | −0.5 | |
Greens | Hsiang-Han Hsieh | 7,278 | 16.6 | +5.2 | |
Independent | Dominique Murphy | 1,084 | 2.5 | +2.5 | |
Animal Justice | Loraine Fabb | 1,014 | 2.3 | +0.3 | |
Family First | Edward Sok | 904 | 2.1 | +2.1 | |
Freedom | Anthony Charles Jacobs | 770 | 1.7 | +1.7 | |
Independent | Parashos Kioupelis | 234 | 0.5 | +0.5 | |
Total formal votes | 43,910 | 95.6 | +1.0 | ||
Informal votes | 2,000 | 4.4 | −1.0 | ||
Turnout | 45,910 | 88.4 | +0.6 | ||
Two-party-preferred result | |||||
Labor | Steve Dimopoulos | 27,876 | 63.5 | −2.6 | |
Liberal | Jim Grivokostopoulos | 16,034 | 36.5 | +2.6 | |
Labor hold | Swing | −2.6 | |||
Party | Candidate | Votes | % | ±% | |
---|---|---|---|---|---|
Labor | Steve Dimopoulos | 19,202 | 53.57 | +7.82 | |
Liberal | Andrew Edmonds | 10,946 | 30.54 | −7.74 | |
Greens | Peter Morgan | 3,897 | 10.87 | −2.41 | |
Animal Justice | Suzanne Parker | 835 | 2.33 | +2.33 | |
Sustainable Australia | Brandon Hoult | 594 | 1.66 | +1.66 | |
Independent | Parashos Kioupelis | 373 | 1.04 | +0.29 | |
Total formal votes | 35,847 | 95.42 | −0.02 | ||
Informal votes | 1,720 | 4.58 | +0.02 | ||
Turnout | 37,567 | 90.32 | −1.76 | ||
Two-party-preferred result | |||||
Labor | Steve Dimopoulos | 23,587 | 65.78 | +7.60 | |
Liberal | Andrew Edmonds | 12,268 | 34.22 | −7.60 | |
Labor hold | Swing | +7.60 | |||
Party | Candidate | Votes | % | ±% | |
---|---|---|---|---|---|
Labor | Steve Dimopoulos | 15,903 | 45.8 | +4.3 | |
Liberal | Theo Zographos | 13,303 | 38.3 | −1.4 | |
Greens | Steven Merriel | 4,617 | 13.3 | −1.5 | |
Independent | Anna Scotto | 677 | 1.9 | +1.9 | |
Independent | Parashos Kioupelis | 260 | 0.7 | +0.7 | |
Total formal votes | 34,760 | 95.4 | −0.1 | ||
Informal votes | 1,662 | 4.6 | +0.1 | ||
Turnout | 36,422 | 92.1 | +2.4 | ||
Two-party-preferred result | |||||
Labor | Steve Dimopoulos | 20,224 | 58.2 | +3.1 | |
Liberal | Theo Zographos | 14,536 | 41.8 | −3.1 | |
Labor hold | Swing | +3.1 | |||
Party | Candidate | Votes | % | ±% | |
---|---|---|---|---|---|
Labor | Ann Barker | 12,888 | 40.97 | −8.87 | |
Liberal | Theo Zographos | 12,616 | 40.11 | +6.61 | |
Greens | Eleanor Whyte | 4,719 | 15.00 | +1.45 | |
Democratic Labor | Matthew Grinter | 488 | 1.55 | +1.55 | |
Family First | George Grigas | 423 | 1.34 | −1.76 | |
Independent | Alan Ide | 323 | 1.03 | +1.03 | |
Total formal votes | 31,457 | 95.61 | −0.74 | ||
Informal votes | 1,444 | 4.39 | +0.74 | ||
Turnout | 32,901 | 92.41 | +0.21 | ||
Two-party-preferred result | |||||
Labor | Ann Barker | 17,268 | 54.82 | −7.55 | |
Liberal | Theo Zographos | 14,234 | 45.18 | +7.55 | |
Labor hold | Swing | -7.55 | |||
Party | Candidate | Votes | % | ±% | |
---|---|---|---|---|---|
Labor | Ann Barker | 15,232 | 49.8 | −4.4 | |
Liberal | Colin Dixon | 10,238 | 33.5 | +2.4 | |
Greens | Matthew Billman | 4,142 | 13.6 | +2.8 | |
Family First | Joyce Khoo | 947 | 3.1 | +3.1 | |
Total formal votes | 30,559 | 96.1 | −0.8 | ||
Informal votes | 1,230 | 3.9 | +0.8 | ||
Turnout | 31,789 | 92.2 | |||
Two-party-preferred result | |||||
Labor | Ann Barker | 19,031 | 62.4 | −2.8 | |
Liberal | Colin Dixon | 11,481 | 37.6 | +2.8 | |
Labor hold | Swing | -2.8 | |||
Party | Candidate | Votes | % | ±% | |
---|---|---|---|---|---|
Labor | Ann Barker | 16,999 | 54.2 | +5.0 | |
Liberal | Peter Goudge | 9,754 | 31.1 | −14.0 | |
Greens | Ollie Bennett | 3,389 | 10.8 | +7.7 | |
Independent | Tina Skouzis | 1,193 | 3.8 | +3.8 | |
Total formal votes | 31,335 | 96.9 | +0.4 | ||
Informal votes | 1,000 | 3.1 | −0.4 | ||
Turnout | 32,335 | 92.4 | |||
Two-party-preferred result | |||||
Labor | Ann Barker | 20,432 | 65.2 | +12.3 | |
Liberal | Peter Goudge | 10,902 | 34.8 | −12.3 | |
Labor hold | Swing | +12.3 | |||
Party | Candidate | Votes | % | ±% | |
---|---|---|---|---|---|
Labor | Ann Barker | 15,060 | 49.2 | +3.4 | |
Liberal | Denise McGill | 13,558 | 44.3 | −3.1 | |
Greens | Susan Walters | 1,107 | 3.6 | +3.6 | |
Independent | Stephanie McGregor | 452 | 1.5 | +1.5 | |
Independent | Loredana Eboli | 268 | 0.9 | +0.9 | |
Natural Law | Raymond Schlager | 148 | 0.5 | −0.6 | |
Total formal votes | 30,593 | 96.5 | −1.1 | ||
Informal votes | 1,118 | 3.5 | +1.1 | ||
Turnout | 31,711 | 92.3 | |||
Two-party-preferred result | |||||
Labor | Ann Barker | 16,286 | 53.3 | +4.1 | |
Liberal | Denise McGill | 14,262 | 46.7 | −4.1 | |
Labor gain from Liberal | Swing | +4.1 | |||
Party | Candidate | Votes | % | ±% | |
---|---|---|---|---|---|
Liberal | Denise McGill | 14,317 | 47.4 | −5.5 | |
Labor | Ann Barker | 13,842 | 45.9 | −1.2 | |
Independent | Cameron Nicholls | 1,140 | 3.8 | +3.8 | |
Independent | Peter Apostolou | 567 | 1.9 | +1.9 | |
Natural Law | David Hamilton | 312 | 1.0 | +1.0 | |
Total formal votes | 30,178 | 97.5 | +2.0 | ||
Informal votes | 763 | 2.5 | −2.0 | ||
Turnout | 30,941 | 93.1 | |||
Two-party-preferred result | |||||
Liberal | Denise McGill | 15,309 | 50.8 | −2.1 | |
Labor | Ann Barker | 14,815 | 49.2 | +2.1 | |
Liberal hold | Swing | -2.1 | |||
Party | Candidate | Votes | % | ±% | |
---|---|---|---|---|---|
Liberal | Denise McGill | 15,485 | 52.9 | +13.3 | |
Labor | Race Mathews | 13,783 | 47.1 | −2.0 | |
Total formal votes | 29,268 | 95.5 | +0.0 | ||
Informal votes | 1,376 | 4.5 | −0.0 | ||
Turnout | 30,644 | 94.1 | |||
Liberal gain from Labor | Swing | +8.6 | |||
Party | Candidate | Votes | % | ±% | |
---|---|---|---|---|---|
Labor | Race Mathews | 12,645 | 50.41 | −3.40 | |
Liberal | Ian Pope | 9,560 | 38.11 | −4.91 | |
Independent | Heather Norling | 1,736 | 6.92 | +6.92 | |
Independent | Antonis Pashos | 919 | 3.66 | +0.49 | |
Independent | Philip Mitchell | 225 | 0.90 | +0.90 | |
Total formal votes | 25,085 | 95.33 | −1.82 | ||
Informal votes | 1,228 | 4.67 | +1.82 | ||
Turnout | 26,313 | 91.54 | −0.26 | ||
Two-party-preferred result | |||||
Labor | Race Mathews | 14,353 | 57.26 | +2.37 | |
Liberal | Ian Pope | 10,715 | 42.74 | −2.37 | |
Labor hold | Swing | +2.37 | |||
Party | Candidate | Votes | % | ±% | |
---|---|---|---|---|---|
Labor | Race Mathews | 14,374 | 53.8 | −0.6 | |
Liberal | Norman Kennedy | 11,493 | 43.0 | +5.1 | |
Independent | Antonios Pashos | 846 | 3.2 | +3.2 | |
Total formal votes | 26,713 | 97.1 | |||
Informal votes | 783 | 2.9 | |||
Turnout | 27,496 | 91.8 | |||
Two-party-preferred result | |||||
Labor | Race Mathews | 14,986 | 56.1 | −3.0 | |
Liberal | Norman Kennedy | 11,727 | 43.9 | +3.0 | |
Labor hold | Swing | -3.0 | |||
Party | Candidate | Votes | % | ±% | |
---|---|---|---|---|---|
Labor | Race Mathews | 13,801 | 52.9 | +6.6 | |
Liberal | Francis Callaghan | 10,227 | 39.2 | −2.0 | |
Democrats | Malcolm Haddrick | 1,219 | 4.7 | −2.7 | |
Democratic Labor | John Mulholland | 833 | 3.2 | −0.3 | |
Total formal votes | 26,080 | 98.0 | +1.0 | ||
Informal votes | 522 | 2.0 | −1.0 | ||
Turnout | 26,602 | 94.5 | +1.2 | ||
Two-party-preferred result | |||||
Labor | Race Mathews | 14,585 | 55.9 | +4.2 | |
Liberal | Francis Callaghan | 11,495 | 44.1 | −4.2 | |
Labor hold | Swing | +4.2 | |||
Party | Candidate | Votes | % | ±% | |
---|---|---|---|---|---|
Labor | Race Mathews | 12,072 | 46.3 | +7.1 | |
Liberal | Alan Scanlan | 10,753 | 41.2 | −5.2 | |
Democrats | Domenico Quadara | 1,921 | 7.4 | +7.4 | |
Democratic Labor | Elaine Mulholland | 910 | 3.5 | +3.5 | |
Australia | David Heath | 433 | 1.7 | −2.5 | |
Total formal votes | 26,089 | 97.0 | −0.6 | ||
Informal votes | 816 | 3.0 | +0.6 | ||
Turnout | 26,905 | 93.3 | −0.1 | ||
Two-party-preferred result | |||||
Labor | Race Mathews | 13,497 | 51.7 | +3.0 | |
Liberal | Alan Scanlan | 12,592 | 48.3 | −3.0 | |
Labor gain from Liberal | Swing | +3.0 | |||
Party | Candidate | Votes | % | ±% | |
---|---|---|---|---|---|
Liberal | Alan Scanlan | 12,411 | 46.4 | −2.6 | |
Labor | Sam Papasavas | 10,450 | 39.1 | −2.7 | |
Independent | Leslie Kausman | 2,766 | 10.4 | +10.4 | |
Australia | Trevor Cooke | 1,110 | 4.2 | +2.4 | |
Total formal votes | 26,737 | 97.6 | |||
Informal votes | 658 | 2.4 | |||
Turnout | 27,395 | 93.4 | |||
Two-party-preferred result | |||||
Liberal | Alan Scanlan | 13,706 | 51.3 | −5.2 | |
Labor | Sam Papasavas | 13,031 | 48.7 | +5.2 | |
Liberal hold | Swing | -5.2 | |||
Party | Candidate | Votes | % | ±% | |
---|---|---|---|---|---|
Liberal | Alan Scanlan | 12,070 | 49.3 | +1.5 | |
Labor | Frank Slater | 10,383 | 42.4 | +3.0 | |
Democratic Labor | Ralph Cleary | 2,011 | 8.2 | −4.7 | |
Total formal votes | 24,464 | 97.1 | +0.3 | ||
Informal votes | 730 | 2.9 | −0.3 | ||
Turnout | 25,194 | 94.0 | −0.9 | ||
Two-party-preferred result | |||||
Liberal | Alan Scanlan | 13,885 | 56.8 | −1.8 | |
Labor | Frank Slater | 10,579 | 43.2 | +1.8 | |
Liberal hold | Swing | -1.8 | |||
Party | Candidate | Votes | % | ±% | |
---|---|---|---|---|---|
Liberal | Alan Scanlan | 11,050 | 47.8 | +1.7 | |
Labor | Anthony Scarcella | 9,108 | 39.4 | −1.1 | |
Democratic Labor | Bernard Slattery | 2,978 | 12.9 | −0.5 | |
Total formal votes | 23,136 | 96.8 | +1.7 | ||
Informal votes | 753 | 3.2 | −1.7 | ||
Turnout | 23,889 | 94.9 | −0.2 | ||
Two-party-preferred result | |||||
Liberal | Alan Scanlan | 13,560 | 58.6 | +0.6 | |
Labor | Anthony Scarcella | 9,576 | 41.4 | −0.6 | |
Liberal hold | Swing | +0.6 | |||
Party | Candidate | Votes | % | ±% | |
---|---|---|---|---|---|
Liberal | Alan Scanlan | 10,598 | 46.1 | +1.8 | |
Labor | Glenn Dudley | 9,310 | 40.5 | −0.3 | |
Democratic Labor | Bernard Slattery | 3,066 | 13.4 | −0.7 | |
Total formal votes | 22,974 | 97.3 | |||
Informal votes | 631 | 2.7 | |||
Turnout | 23,605 | 95.1 | |||
Two-party-preferred result | |||||
Liberal | Alan Scanlan | 13,327 | 58.0 | +0.5 | |
Labor | Glenn Dudley | 9,647 | 42.0 | −0.5 | |
Liberal hold | Swing | +0.5 | |||
Party | Candidate | Votes | % | ±% | |
---|---|---|---|---|---|
Liberal and Country | Alan Scanlan | 9,935 | 45.5 | +5.6 | |
Labor | Val Doube | 8,946 | 41.0 | −4.5 | |
Democratic Labor | Morris Kinnane | 2,733 | 12.5 | −2.1 | |
Independent | Jean McKeown | 224 | 1.0 | +1.0 | |
Total formal votes | 21,838 | 98.1 | −0.3 | ||
Informal votes | 427 | 1.9 | +0.3 | ||
Turnout | 22,265 | 95.4 | +0.3 | ||
Two-party-preferred result | |||||
Liberal and Country | Alan Scanlan | 12,559 | 57.5 | +5.0 | |
Labor | Val Doube | 9,279 | 42.5 | −5.0 | |
Liberal and Country hold | Swing | +5.0 | |||
Party | Candidate | Votes | % | ±% | |
---|---|---|---|---|---|
Labor | Val Doube | 9,842 | 45.5 | −4.5 | |
Liberal and Country | Alan Scanlan | 8,648 | 39.9 | +1.3 | |
Democratic Labor | Morris Kinnane | 3,165 | 14.6 | +3.2 | |
Total formal votes | 21,655 | 98.4 | −0.4 | ||
Informal votes | 356 | 1.6 | +0.4 | ||
Turnout | 22,011 | 95.1 | −0.4 | ||
Two-party-preferred result | |||||
Liberal and Country | Alan Scanlan | 11,360 | 52.5 | +4.2 | |
Labor | Val Doube | 10,295 | 47.5 | −4.2 | |
Liberal and Country gain from Labor | Swing | +4.2 | |||
Party | Candidate | Votes | % | ±% | |
---|---|---|---|---|---|
Labor | Val Doube | 10,694 | 50.0 | ||
Liberal and Country | William Downard | 8,243 | 38.6 | ||
Democratic Labor | John Heffernan | 2,436 | 11.4 | ||
Total formal votes | 21,373 | 98.8 | |||
Informal votes | 264 | 1.2 | |||
Turnout | 21,637 | 95.5 | |||
Two-party-preferred result | |||||
Labor | Val Doube | 11,060 | 51.7 | ||
Liberal and Country | William Downard | 10,313 | 48.3 | ||
Labor hold | Swing | ||||
Party | Candidate | Votes | % | ±% | |
---|---|---|---|---|---|
Labor | Val Doube | 9,111 | 49.1 | ||
Liberal and Country | Edmund Fox | 7,564 | 40.8 | ||
Labor (A-C) | Donald Murray | 1,874 | 10.1 | ||
Total formal votes | 18,549 | 98.7 | |||
Informal votes | 247 | 1.3 | |||
Turnout | 18,796 | 95.1 | |||
Two-party-preferred result | |||||
Labor | Val Doube | 9,377 | 50.6 | ||
Liberal and Country | Edmund Fox | 9,172 | 49.4 | ||
Labor hold | Swing | ||||
Party | Candidate | Votes | % | ±% | |
---|---|---|---|---|---|
Labor | Val Doube | 17,308 | 65.5 | +19.8 | |
Liberal and Country | Charles Laming | 9,135 | 34.5 | +0.1 | |
Total formal votes | 26,443 | 98.5 | −0.6 | ||
Informal votes | 405 | 1.5 | +0.6 | ||
Turnout | 26,848 | 94.1 | −1.4 | ||
Labor hold | Swing | +14.4 | |||
Party | Candidate | Votes | % | ±% | |
---|---|---|---|---|---|
Labor | Val Doube | 11,720 | 45.7 | −3.2 | |
Liberal and Country | Charles Laming | 8,833 | 34.4 | −16.7 | |
Independent | John Lechte | 5,084 | 19.8 | +19.8 | |
Total formal votes | 25,637 | 99.1 | −0.2 | ||
Informal votes | 230 | 0.9 | +0.2 | ||
Turnout | 25,867 | 95.5 | +0.6 | ||
Two-party-preferred result | |||||
Labor | Val Doube | 12,820 | 50.0 | +1.1 | |
Liberal and Country | Charles Laming | 12,817 | 50.0 | −1.1 | |
Labor gain from Liberal and Country | Swing | +1.1 | |||
Party | Candidate | Votes | % | ±% | |
---|---|---|---|---|---|
Liberal | John Lechte | 12,630 | 51.1 | +14.3 | |
Labor | Squire Reid | 12,085 | 48.9 | −14.3 | |
Total formal votes | 24,715 | 99.3 | +0.4 | ||
Informal votes | 180 | 0.7 | −0.4 | ||
Turnout | 24,895 | 94.9 | +5.3 | ||
Liberal gain from Labor | Swing | +14.3 | |||
Party | Candidate | Votes | % | ±% | |
---|---|---|---|---|---|
Labor | Squire Reid | 13,683 | 63.2 | ||
Liberal | James Smith | 7,959 | 36.8 | ||
Total formal votes | 21,649 | 98.9 | |||
Informal votes | 229 | 1.1 | |||
Turnout | 21,871 | 89.6 | |||
Labor hold | Swing | ||||
Party | Candidate | Votes | % | ±% | |
---|---|---|---|---|---|
Labor | Squire Reid | 19,687 | 58.1 | +3.1 | |
United Australia | Andrew Sinclair | 14,214 | 41.9 | −3.1 | |
Total formal votes | 33,901 | 98.8 | −0.2 | ||
Informal votes | 396 | 1.2 | +0.2 | ||
Turnout | 34,297 | 87.8 | −6.8 | ||
Labor hold | Swing | +3.1 | |||
Party | Candidate | Votes | % | ±% | |
---|---|---|---|---|---|
Labor | Squire Reid | 17,451 | 55.0 | +2.7 | |
United Australia | Lyston Chisholm | 14,287 | 45.0 | −2.7 | |
Total formal votes | 31,738 | 99.0 | −0.2 | ||
Informal votes | 309 | 1.0 | +0.2 | ||
Turnout | 32,047 | 94.6 | +0.7 | ||
Labor hold | Swing | +2.7 | |||
Party | Candidate | Votes | % | ±% | |
---|---|---|---|---|---|
Labor | Squire Reid | 15,751 | 52.3 | +2.6 | |
United Australia | James Smith | 14,340 | 47.7 | −2.6 | |
Total formal votes | 30,091 | 99.2 | +0.3 | ||
Informal votes | 258 | 0.8 | −0.3 | ||
Turnout | 30,349 | 93.9 | −0.9 | ||
Labor gain from United Australia | Swing | +2.6 | |||
Party | Candidate | Votes | % | ±% | |
---|---|---|---|---|---|
United Australia | James Vinton Smith | 13,978 | 50.3 | +23.9 | |
Labor | Squire Reid | 13,813 | 49.7 | +9.4 | |
Total formal votes | 27,791 | 98.9 | 0.0 | ||
Informal votes | 272 | 1.1 | 0.0 | ||
Turnout | 28,063 | 94.8 | +0.2 | ||
United Australia gain from Independent | Swing | N/A | |||
Party | Candidate | Votes | % | ±% | |
---|---|---|---|---|---|
Labor | Squire Reid | 10,654 | 40.3 | −16.7 | |
Independent | James Smith | 8,794 | 33.3 | +33.3 | |
United Australia | Lyston Chisholm | 6,991 | 26.4 | −16.4 | |
Total formal votes | 26,439 | 98.9 | −0.3 | ||
Informal votes | 282 | 1.1 | +0.3 | ||
Turnout | 26,721 | 94.6 | +0.7 | ||
Two-candidate-preferred result | |||||
Independent | James Smith | 15,002 | 56.7 | +56.7 | |
Labor | Squire Reid | 11,437 | 43.3 | −13.7 | |
Independent gain from Labor | Swing | N/A | |||
Party | Candidate | Votes | % | ±% | |
---|---|---|---|---|---|
Labor | Squire Reid | 14,580 | 57.0 | +15.2 | |
Nationalist | Duncan Mackinnon | 10,986 | 43.0 | +5.9 | |
Total formal votes | 25,566 | 99.2 | +1.3 | ||
Informal votes | 212 | 0.8 | −1.3 | ||
Turnout | 25,778 | 93.9 | +0.1 | ||
Labor hold | Swing | +6.7 | |||
Party | Candidate | Votes | % | ±% | |
---|---|---|---|---|---|
Labor | Squire Reid | 9,500 | 41.8 | ||
Nationalist | Robert Knox | 8,421 | 37.1 | ||
Australian Liberal | Thomas Riley | 4,786 | 21.1 | ||
Total formal votes | 22,707 | 97.9 | |||
Informal votes | 483 | 2.1 | |||
Turnout | 23,190 | 93.8 | |||
Two-party-preferred result | |||||
Labor | Squire Reid | 11,427 | 50.3 | ||
Nationalist | Robert Knox | 11,280 | 49.7 | ||
Labor gain from Nationalist | Swing | ||||
Southern Metropolitan Region is one of the eight electoral regions of Victoria, Australia, which elects five members to the Victorian Legislative Council by proportional representation. The region was created in 2006 following the 2005 reform of the Victorian Legislative Council.
This is a list of electoral results for the Electoral district of Cranbourne in Victorian state elections.
This is a list of electoral results for the Electoral district of Melbourne in Victorian state elections.
This is a list of electoral results for the Electoral district of Monbulk in Victorian state elections.
This is a list of electoral results for the Electoral district of Mordialloc in Victorian state elections.
This is a list of electoral results for the Electoral district of Mornington in Victorian state elections.
This is a list of electoral results for the Electoral district of Morwell in Victorian state elections.
This is a list of electoral results for the district of Mulgrave in Victorian state elections.
This is a list of electoral results for the district of Narracan in Victorian state elections.
This is a list of electoral results for the Electoral district of Narre Warren North in Victorian state elections.
This is a list of electoral results for the Electoral district of Nepean in Victorian state elections.
This is a list of electoral results for the Electoral district of Niddrie in Victorian state elections.
This is a list of electoral results for the Electoral district of Northcote in Victorian state elections.
This is a list of electoral results for the Electoral district of Polwarth in Victorian state elections.
This is a list of electoral results for the Electoral district of Sandringham in Victorian state elections.
This is a list of electoral results for the Electoral district of South-West Coast in Victorian state elections.
This is a list of electoral results for the Electoral district of Warrandyte in Victorian state elections.
This is a list of electoral results for the district of Yan Yean in Victorian state elections.
This is a list of electoral results for the Electoral district of Yuroke in Victorian state elections.
This is a list of electoral district results for the Victorian 2014 election for the Legislative Assembly.