Related Research Articles
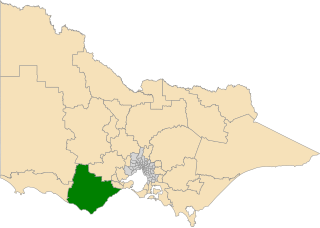
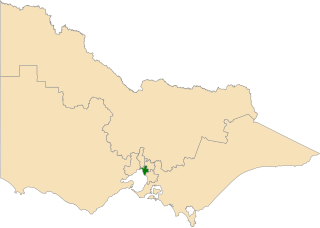
The electoral district of Polwarth is an electoral district of the Victorian Legislative Assembly. It is located in south-west rural Victoria, west of Geelong, and covers the Colac and Corangamite local government areas (LGA), parts of the Moyne, Golden Plains and Surf Coast LGAs, and slivers of the Ararat and Greater Geelong LGAs, running along the Great Ocean Road taking in Anglesea, Cape Otway, Peterborough, Aireys Inlet, Lorne, Wye River, Apollo Bay and Port Campbell, covering the inland towns of Winchelsea, Colac, Camperdown and Terang along the Princes Highway, and Inverleigh, Cressy, Lismore and Mortlake on the Hamilton Highway, and finally, includes the Otway Ranges and Lake Corangamite.

The electoral district of Evelyn is an electorate of the Victorian Legislative Assembly covering the urban fringe north east of Melbourne. It was first proclaimed in 1859.

The electoral district of Caulfield is an electoral district of the Victorian Legislative Assembly that has existed since 1927.
Southern Metropolitan Region is one of the eight electoral regions of Victoria, Australia, which elects five members to the Victorian Legislative Council by proportional representation. The region was created in 2006 following the 2005 reform of the Victorian Legislative Council.

The electoral district of Lowan is a rural Victorian Legislative Assembly electoral district of the Victorian Parliament. It is located within the Western Victoria Region of the Legislative Council. It was initially created by the Electoral Act Amendment Act 1888, taking effect at the 1889 elections. It is the state’s biggest electorate by area, covering about 41,858 km².

The electoral district of Berwick is an electoral district of the Legislative Assembly in the Australian state of Victoria.

The electoral district of Glen Waverley is an electoral district of the Legislative Assembly in the Australian state of Victoria.
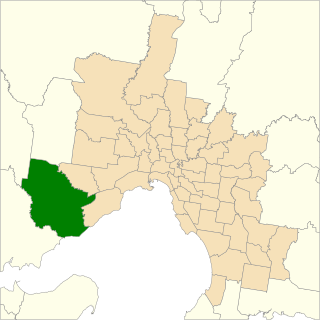
The electoral district of Werribee is an electoral district of the Legislative Assembly in the Australian state of Victoria. It has existed in two incarnations, first from 1976 to 2002, and was created again in the 2013 redistribution and came into effect at the 2014 state election.
This is a list of electoral results for the district of Mulgrave in Victorian state elections.
This is a list of electoral results for the Electoral district of Warrandyte in Victorian state elections.
The electoral district of Ringwood is an electoral district of the Victorian Legislative Assembly, located in the east of Melbourne. It was first proclaimed in 1958 and was abolished in 1992. Some of Ringwood was included in the new electoral district of Bayswater that year. Kay Setches, who was at the time the last member for Ringwood, contested and lost Bayswater at the 1992 election.

The electoral district of Murray Plains is an electoral district of the Victorian Legislative Assembly in Australia. It was created in the redistribution of electoral boundaries in 2013, and came into effect at the 2014 state election.
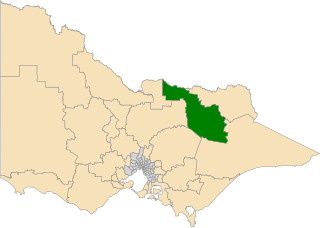
The electoral district of Ovens Valley is an electoral district of the Victorian Legislative Assembly in Australia. It was created in the redistribution of electoral boundaries in 2013, and came into effect at the 2014 state election.
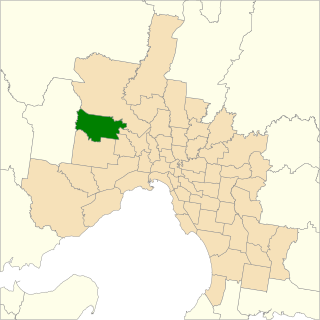
The electoral district of Sydenham is an electoral district of the Victorian Legislative Assembly in Australia. It was created in the redistribution of electoral boundaries in 2013, and came into effect at the 2014 state election.

The Division of Macnamara is an Australian Electoral Division in the state of Victoria, which was contested for the first time at the 2019 federal election. The division is named in honour of Dame Jean Macnamara, a doctor and medical researcher who specialised in the polio virus and was involved in children's health initiatives.

The Electoral district of Laverton is an electoral district of the Victorian Legislative Assembly in Australia. It was created in the redistribution of electoral boundaries in 2021, and came into effect at the 2022 Victorian state election.

The electoral district of Greenvale is an electoral district of the Victorian Legislative Assembly in Australia. It was created in the redistribution of electoral boundaries in 2021, and came into effect at the 2022 Victorian state election.

The Electoral district of Kalkallo is an electoral district of the Victorian Legislative Assembly in Australia. It was created in the redistribution of electoral boundaries in 2021, and came into effect at the 2022 Victorian state election.
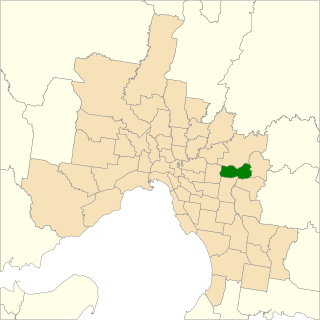
This is a list of electoral results for the electoral district of Caulfield East in Victorian state elections.

This is a list of electoral district results for the 2022 Victorian state election for the Legislative Assembly.
References
- "Caulfield District results". Victorian Electoral Commission. Archived from the original on 21 March 2012. Retrieved 20 November 2011.
- ↑ Caulfield District results, Victorian Electoral Commission. Retrieved 1 December 2022.
- ↑ State Election 2018: Caulfield District, VEC.