This is a list of electoral results for the district of Brighton in Victorian state elections.
Member | Party | Term | |
---|---|---|---|
Jonathan Binns Were | Unaligned | 1856–1857 | |
Charles Ebden | Unaligned | 1857–1861 | |
George Higinbotham | Unaligned | 1861-1861 | |
William Brodribb | Unaligned | 1861–1862 | |
George Higinbotham | Unaligned | 1862–1871 | |
Sir Thomas Bent | Unaligned | 1871–1894 | |
William Moule | Unaligned | 1894–1900 | |
Sir Thomas Bent | Unaligned | 1900–1909 | |
Oswald Snowball | Liberal | 1909–1917 | |
Nationalist | 1917–1924 | ||
Australian Liberal | 1924–1927 | ||
Independent Nationalist | 1927–1928 | ||
Ian Macfarlan | Nationalist | 1928–1931 | |
United Australia | 1931–1937 | ||
Independent | 1937–1943 | ||
United Australia | 1943–1945 | ||
Liberal | 1945 | ||
Ray Tovell | Liberal | 1945–1955 | |
Electoral Reform League | |||
Sir John Rossiter | Liberal | 1955–1976 | |
Jeannette Patrick | Liberal | 1976–1985 | |
Alan Stockdale | Liberal | 1985–1999 | |
Louise Asher | Liberal | 1999–2018 | |
James Newbury | Liberal | 2018–present |
Party | Candidate | Votes | % | ±% | |
---|---|---|---|---|---|
Liberal | James Newbury | 18,791 | 45.6 | +0.8 | |
Labor | Louise Crawford | 10,164 | 24.7 | −7.4 | |
Greens | Sarah Dekiere | 5,680 | 13.8 | −1.1 | |
Independent | Felicity Frederico | 3,749 | 9.1 | +9.1 | |
Independent | Sally Gibson | 941 | 2.3 | +2.3 | |
Animal Justice | Alicia Walker | 851 | 2.1 | −2.8 | |
Family First | Nick Sciola | 558 | 1.4 | +1.4 | |
Ind. (Protector) | John Tiger Casley | 251 | 0.6 | −0.2 | |
Independent | Allan L. Timms | 211 | 0.5 | +0.5 | |
Total formal votes | 41,196 | 95.8 | +0.1 | ||
Informal votes | 1,786 | 4.2 | −0.1 | ||
Turnout | 42,982 | 89.1 | +1.5 | ||
Two-party-preferred result | |||||
Liberal | James Newbury | 22,710 | 55.1 | +4.6 | |
Labor | Louise Crawford | 18,486 | 44.9 | −4.6 | |
Liberal hold | Swing | +4.6 |
Party | Candidate | Votes | % | ±% | |
---|---|---|---|---|---|
Liberal | James Newbury | 17,597 | 45.40 | −10.12 | |
Labor | Declan Martin | 12,193 | 31.46 | +7.90 | |
Greens | Katherine Copsey | 5,854 | 15.10 | −2.28 | |
Animal Justice | Cathy Taylor | 1,961 | 5.06 | +5.06 | |
Sustainable Australia | Alison Pridham | 881 | 2.27 | +2.27 | |
Independent | John Tiger Casley | 273 | 0.70 | +0.70 | |
Total formal votes | 38,759 | 95.81 | −0.59 | ||
Informal votes | 1,697 | 4.19 | +0.59 | ||
Turnout | 40,456 | 89.46 | −2.59 | ||
Two-party-preferred result | |||||
Liberal | James Newbury | 19,812 | 51.12 | −8.66 | |
Labor | Declan Martin | 18,947 | 48.88 | +8.66 | |
Liberal hold | Swing | −8.66 |
Party | Candidate | Votes | % | ±% | |
---|---|---|---|---|---|
Liberal | Louise Asher | 21,145 | 55.5 | −3.0 | |
Labor | Louise Crawford | 8,973 | 23.6 | +3.5 | |
Greens | Margaret Beavis | 6,619 | 17.4 | +0.1 | |
Independent | Jane Touzeau | 1,350 | 3.5 | +3.5 | |
Total formal votes | 38,087 | 96.4 | −0.1 | ||
Informal votes | 1,425 | 3.6 | +0.1 | ||
Turnout | 39,512 | 92.1 | −0.1 | ||
Two-party-preferred result | |||||
Liberal | Louise Asher | 22,777 | 59.8 | −4.6 | |
Labor | Louise Crawford | 15,330 | 40.2 | +4.6 | |
Liberal hold | Swing | −4.6 |
Party | Candidate | Votes | % | ±% | |
---|---|---|---|---|---|
Liberal | Louise Asher | 21,375 | 62.51 | +7.60 | |
Labor | Tom Daley | 6,661 | 19.48 | −6.27 | |
Greens | Margaret Beavis | 5,465 | 15.98 | +2.69 | |
Family First | Laurence Giddings | 353 | 1.03 | −0.77 | |
Independent | A.L. Thompson | 343 | 1.00 | +1.00 | |
Total formal votes | 34,197 | 96.57 | −0.57 | ||
Informal votes | 1,215 | 3.43 | +0.57 | ||
Turnout | 35,412 | 92.30 | +0.59 | ||
Two-party-preferred result | |||||
Liberal | Louise Asher | 23,091 | 67.56 | +6.63 | |
Labor | Tom Daley | 11,089 | 32.44 | −6.63 | |
Liberal hold | Swing | +6.63 |
Party | Candidate | Votes | % | ±% | |
---|---|---|---|---|---|
Liberal | Louise Asher | 18,067 | 54.91 | +1.72 | |
Labor | Jane Shelton | 8,473 | 25.75 | −5.14 | |
Greens | Jonathan Walters | 4,372 | 13.29 | −2.63 | |
Independent | Clifford Hayes | 1,398 | 4.25 | +4.25 | |
Family First | Mark Freeman | 592 | 1.80 | +1.80 | |
Total formal votes | 32,902 | 97.14 | −0.53 | ||
Informal votes | 968 | 2.86 | +0.53 | ||
Turnout | 33,870 | 91.71 | +1.58 | ||
Two-party-preferred result | |||||
Liberal | Louise Asher | 20,041 | 60.93 | +3.52 | |
Labor | Jane Shelton | 12,853 | 39.07 | −3.52 | |
Liberal hold | Swing | +3.52 |
Party | Candidate | Votes | % | ±% | |
---|---|---|---|---|---|
Liberal | Louise Asher | 17,094 | 53.2 | −4.2 | |
Labor | Rachelle Sapir | 9,926 | 30.9 | +6.3 | |
Greens | Clive Davies | 5,116 | 15.9 | +15.9 | |
Total formal votes | 32,136 | 97.7 | −0.2 | ||
Informal votes | 765 | 2.3 | +0.2 | ||
Turnout | 32,901 | 90.1 | |||
Two-party-preferred result | |||||
Liberal | Louise Asher | 18,447 | 57.4 | −7.2 | |
Labor | Rachelle Sapir | 13,686 | 42.6 | +7.2 | |
Liberal hold | Swing | -7.2 |
Party | Candidate | Votes | % | ±% | |
---|---|---|---|---|---|
Liberal | Louise Asher | 17,701 | 57.9 | −8.8 | |
Labor | Irene Dunsmuir | 6,973 | 22.8 | −7.3 | |
Independent | Alex Del Porto | 5,920 | 19.4 | +19.4 | |
Total formal votes | 30,594 | 97.9 | −0.4 | ||
Informal votes | 664 | 2.1 | +0.4 | ||
Turnout | 31,258 | 91.3 | |||
Two-party-preferred result | |||||
Liberal | Louise Asher | 20,061 | 65.6 | −2.5 | |
Labor | Irene Dunsmuir | 10,529 | 34.4 | +2.5 | |
Liberal hold | Swing | -2.5 |
Party | Candidate | Votes | % | ±% | |
---|---|---|---|---|---|
Liberal | Alan Stockdale | 20,299 | 66.6 | −3.6 | |
Labor | Mario Lucas | 9,165 | 30.1 | +6.5 | |
Natural Law | Jacinta Lynch | 1,009 | 3.3 | −1.7 | |
Total formal votes | 30,473 | 98.2 | +1.5 | ||
Informal votes | 549 | 1.8 | −1.5 | ||
Turnout | 31,022 | 92.8 | |||
Two-party-preferred result | |||||
Liberal | Alan Stockdale | 20,738 | 68.1 | −4.7 | |
Labor | Mario Lucas | 9,702 | 31.9 | +4.7 | |
Liberal hold | Swing | -4.7 |
Party | Candidate | Votes | % | ±% | |
---|---|---|---|---|---|
Liberal | Alan Stockdale | 20,936 | 70.3 | +8.8 | |
Labor | Leigh Jones | 7,016 | 23.5 | −12.4 | |
Natural Law | Keith Pryor | 1,491 | 5.0 | +5.0 | |
Pensioner and CIR | John Casley | 355 | 1.2 | +1.2 | |
Total formal votes | 29,798 | 96.7 | −0.4 | ||
Informal votes | 1,004 | 3.3 | +0.4 | ||
Turnout | 30,802 | 94.0 | |||
Two-party-preferred result | |||||
Liberal | Alan Stockdale | 21,686 | 72.8 | +10.2 | |
Labor | Leigh Johns | 8,092 | 27.2 | −10.2 | |
Liberal hold | Swing | +10.2 |
Party | Candidate | Votes | % | ±% | |
---|---|---|---|---|---|
Liberal | Alan Stockdale | 16,651 | 61.88 | −0.22 | |
Labor | Jennifer Huppert | 9,642 | 35.83 | −2.07 | |
Independent | John Casley | 617 | 2.29 | +2.29 | |
Total formal votes | 26,910 | 97.14 | −0.28 | ||
Informal votes | 792 | 2.86 | +0.28 | ||
Turnout | 27,702 | 92.08 | +0.14 | ||
Two-party-preferred result | |||||
Liberal | Alan Stockdale | 16,968 | 63.05 | +0.95 | |
Labor | Jennifer Huppert | 9,942 | 36.95 | −0.95 | |
Liberal hold | Swing | +0.95 |
Party | Candidate | Votes | % | ±% | |
---|---|---|---|---|---|
Liberal | Alan Stockdale | 17,301 | 62.1 | +4.0 | |
Labor | Leslie Heimann | 10,560 | 37.9 | +6.0 | |
Total formal votes | 27,861 | 97.4 | |||
Informal votes | 737 | 2.6 | |||
Turnout | 28,598 | 91.9 | |||
Liberal hold | Swing | +3.8 |
Party | Candidate | Votes | % | ±% | |
---|---|---|---|---|---|
Liberal | Jeannette Patrick | 13,807 | 57.8 | −4.9 | |
Labor | Garry Moore | 7,804 | 32.7 | −4.6 | |
Democrats | George Dart | 2,263 | 9.5 | +9.5 | |
Total formal votes | 23,874 | 98.3 | +0.7 | ||
Informal votes | 418 | 1.7 | −0.7 | ||
Turnout | 24,292 | 93.6 | +2.2 | ||
Two-party-preferred result | |||||
Liberal | Jeannette Patrick | 14,769 | 61.9 | −0.8 | |
Labor | Garry Moore | 9,108 | 38.1 | +0.8 | |
Liberal hold | Swing | -0.8 |
Party | Candidate | Votes | % | ±% | |
---|---|---|---|---|---|
Liberal | Jeannette Patrick | 15,260 | 62.7 | +0.9 | |
Labor | Christopher Kennedy | 9,062 | 37.3 | +8.6 | |
Total formal votes | 24,322 | 97.6 | −0.5 | ||
Informal votes | 598 | 2.4 | +0.5 | ||
Turnout | 24,920 | 91.4 | −0.9 | ||
Liberal hold | Swing | -5.4 |
Party | Candidate | Votes | % | ±% | |
---|---|---|---|---|---|
Liberal | Jeannette Patrick | 15,925 | 61.8 | +3.9 | |
Labor | Robert Gerrand | 7,404 | 28.7 | +0.3 | |
Australia | Ian Mullins | 1,267 | 4.9 | +4.9 | |
Democratic Labor | Peter Lawlor | 1,168 | 4.5 | −0.9 | |
Total formal votes | 25,764 | 98.1 | |||
Informal votes | 492 | 1.9 | |||
Turnout | 26,256 | 92.3 | |||
Two-party-preferred result | |||||
Liberal | Jeannette Patrick | 17,533 | 68.1 | −0.3 | |
Labor | Robert Gerrand | 8,231 | 31.9 | +0.3 | |
Liberal hold | Swing | -0.3 |
Party | Candidate | Votes | % | ±% | |
---|---|---|---|---|---|
Liberal | John Rossiter | 13,807 | 58.5 | +14.8 | |
Labor | Peter Hansen | 6,372 | 27.0 | −4.4 | |
Australia | Frederick Funnell | 2,150 | 9.1 | +9.1 | |
Democratic Labor | Peter Lawlor | 1,285 | 5.4 | −3.7 | |
Total formal votes | 23,614 | 98.0 | +0.2 | ||
Informal votes | 471 | 2.0 | −0.2 | ||
Turnout | 24,085 | 93.1 | +0.1 | ||
Two-party-preferred result | |||||
Liberal | John Rossiter | 15,975 | 67.7 | +2.1 | |
Labor | Peter Hansen | 7,639 | 32.3 | −2.1 | |
Liberal hold | Swing | +2.1 |
Party | Candidate | Votes | % | ±% | |
---|---|---|---|---|---|
Liberal | John Rossiter | 9,812 | 43.7 | −16.3 | |
Labor | Peter Hansen | 7,048 | 31.4 | +4.6 | |
Independent | Malcolm Wallace-Mitchell | 3,562 | 15.8 | +15.8 | |
Democratic Labor | Keith Linard | 2,053 | 9.1 | −4.0 | |
Total formal votes | 22,475 | 97.8 | +0.3 | ||
Informal votes | 516 | 2.2 | −0.3 | ||
Turnout | 22,991 | 93.0 | −0.4 | ||
Two-party-preferred result | |||||
Liberal | John Rossiter | 14,742 | 65.6 | −5.6 | |
Labor | Peter Hansen | 7,733 | 34.4 | +5.6 | |
Liberal hold | Swing | -5.6 |
Party | Candidate | Votes | % | ±% | |
---|---|---|---|---|---|
Liberal | John Rossiter | 13,661 | 60.0 | −5.0 | |
Labor | Bill Walsh | 6,106 | 26.8 | +4.0 | |
Democratic Labor | John Wagstaff | 2,984 | 13.1 | +0.9 | |
Total formal votes | 22,751 | 97.5 | |||
Informal votes | 584 | 2.5 | |||
Turnout | 23,335 | 93.4 | |||
Two-party-preferred result | |||||
Liberal | John Rossiter | 16,198 | 71.2 | −4.2 | |
Labor | Bill Walsh | 6,553 | 28.8 | +4.2 | |
Liberal hold | Swing | -4.2 |
Party | Candidate | Votes | % | ±% | |
---|---|---|---|---|---|
Liberal and Country | John Rossiter | 11,727 | 61.0 | +2.7 | |
Labor | Andrew Reid | 5,000 | 26.0 | −1.7 | |
Democratic Labor | Edwin McSweeney | 2,481 | 12.9 | −1.0 | |
Total formal votes | 19,208 | 98.4 | +0.1 | ||
Informal votes | 310 | 1.6 | −0.1 | ||
Turnout | 19,518 | 92.4 | −1.3 | ||
Two-party-preferred result | |||||
Liberal and Country | John Rossiter | 13,836 | 72.0 | +1.8 | |
Labor | Andrew Reid | 5,372 | 28.0 | −1.8 | |
Liberal and Country hold | Swing | +1.8 |
Party | Candidate | Votes | % | ±% | |
---|---|---|---|---|---|
Liberal and Country | John Rossiter | 11,218 | 58.3 | −8.7 | |
Labor | Geoffrey Blunden | 5,333 | 27.7 | −5.3 | |
Democratic Labor | Edwin McSweeney | 2,678 | 13.9 | +13.9 | |
Total formal votes | 19,229 | 98.3 | −0.1 | ||
Informal votes | 323 | 1.7 | +0.1 | ||
Turnout | 19,552 | 93.7 | 0.0 | ||
Two-party-preferred result | |||||
Liberal and Country | John Rossiter | 13,494 | 70.2 | +3.2 | |
Labor | Geoffrey Blunden | 5,735 | 29.8 | −3.2 | |
Liberal and Country hold | Swing | +3.2 |
Party | Candidate | Votes | % | ±% | |
---|---|---|---|---|---|
Liberal and Country | John Rossiter | 13,250 | 67.0 | ||
Labor | Reginald Hayes | 6,537 | 33.0 | ||
Total formal votes | 19,787 | 98.4 | |||
Informal votes | 317 | 1.6 | |||
Turnout | 20,104 | 93.7 | |||
Liberal and Country hold | Swing |
Party | Candidate | Votes | % | ±% | |
---|---|---|---|---|---|
Liberal and Country | John Rossiter | 9,363 | 53.3 | ||
Victorian Liberal | Ray Tovell | 4,947 | 28.1 | ||
Independent Labor | Marcella Sullivan | 3,269 | 18.6 | ||
Total formal votes | 17,579 | 98.1 | |||
Informal votes | 347 | 1.9 | |||
Turnout | 17,926 | 92.7 | |||
Two-candidate-preferred result | |||||
Liberal and Country | John Rossiter | 10,998 | 62.6 | ||
Victorian Liberal | Ray Tovell | 6,581 | 37.4 | ||
Liberal and Country gain from Victorian Liberal | Swing |
Party | Candidate | Votes | % | ±% | |
---|---|---|---|---|---|
Electoral Reform | Ray Tovell | 12,167 | 48.2 | +48.2 | |
Independent | Allistair Bruce | 5,786 | 22.9 | +22.9 | |
Liberal and Country | Raymond Trickey | 4,874 | 19.3 | −80.7 | |
Independent | Grace Stratton | 1,244 | 4.9 | +4.9 | |
Independent | Finlay Julyan | 1,174 | 4.7 | +4.7 | |
Total formal votes | 25,245 | 97.6 | |||
Informal votes | 631 | 2.4 | |||
Turnout | 25,876 | 94.0 | |||
Two-candidate-preferred result | |||||
Electoral Reform | Ray Tovell | 15,729 | 62.3 | +62.3 | |
Independent | Allistair Bruce | 9,516 | 37.7 | +37.7 | |
Electoral Reform gain from Liberal and Country | Swing | N/A |
Party | Candidate | Votes | % | ±% | |
---|---|---|---|---|---|
Liberal and Country | Ray Tovell | unopposed | |||
Liberal and Country hold | Swing |
Party | Candidate | Votes | % | ±% | |
---|---|---|---|---|---|
Liberal | Ray Tovell | 16,464 | 65.2 | +24.6 | |
Independent | Ian Macfarlan | 8,795 | 34.8 | +34.8 | |
Total formal votes | 25,259 | 97.5 | −1.2 | ||
Informal votes | 659 | 2.5 | +1.2 | ||
Turnout | 25,918 | 93.2 | +5.3 | ||
Liberal hold | Swing | N/A |
Party | Candidate | Votes | % | ±% | |
---|---|---|---|---|---|
Liberal | Ray Tovell | 9,040 | 40.6 | ||
Labor | Val Doube | 6,746 | 30.3 | ||
Ministerial Liberal | Ian Macfarlan | 6,499 | 29.2 | ||
Total formal votes | 22,285 | 98.7 | |||
Informal votes | 283 | 1.3 | |||
Turnout | 22,568 | 87.9 | |||
Two-party-preferred result | |||||
Liberal | Ray Tovell | 14,106 | 62.9 | ||
Labor | Val Doube | 8,269 | 37.1 | ||
Liberal hold | Swing |
Party | Candidate | Votes | % | ±% | |
---|---|---|---|---|---|
United Australia | Ian Macfarlan | 12,217 | 39.1 | +9.6 | |
Labor | Robert Gault | 9,716 | 31.2 | +31.2 | |
Ind. United Australia | John Warren | 9,240 | 29.6 | +29.6 | |
Total formal votes | 31,173 | 98.0 | +0.2 | ||
Informal votes | 648 | 2.0 | −0.2 | ||
Turnout | 31,821 | 88.4 | −5.8 | ||
Two-party-preferred result | |||||
United Australia | Ian Macfarlan | 20,211 | 64.8 | ||
Labor | Robert Gault | 10,962 | 35.2 | ||
United Australia gain from Independent | Swing | N/A |
Party | Candidate | Votes | % | ±% | |
---|---|---|---|---|---|
Independent | Ian Macfarlan | 16,507 | 57.2 | +57.2 | |
United Australia | Robert Breen | 8,519 | 29.5 | −52.5 | |
Independent | John Warren | 3,845 | 13.3 | +13.3 | |
Total formal votes | 28,871 | 97.8 | 0.0 | ||
Informal votes | 662 | 2.2 | 0.0 | ||
Turnout | 29,533 | 94.2 | +1.5 | ||
Independent gain from United Australia | Swing | N/A |
Party | Candidate | Votes | % | ±% | |
---|---|---|---|---|---|
United Australia | Ian MacFarlan | 21,539 | 82.0 | +30.9 | |
Communist | Gerald O'Day | 4,737 | 18.0 | +18.0 | |
Total formal votes | 26,276 | 97.8 | −0.6 | ||
Informal votes | 593 | 2.2 | +0.6 | ||
Turnout | 26,869 | 92.7 | −2.3 | ||
United Australia hold | Swing | N/A |
Party | Candidate | Votes | % | ±% | |
---|---|---|---|---|---|
United Australia | Ian Macfarlan | 12,786 | 51.1 | −48.9 | |
Independent | Edmund Herring | 12,258 | 48.9 | +48.9 | |
Total formal votes | 25,044 | 98.4 | |||
Informal votes | 398 | 1.6 | |||
Turnout | 25,442 | 95.0 | |||
United Australia hold | Swing | N/A |
Party | Candidate | Votes | % | ±% | |
---|---|---|---|---|---|
United Australia | Ian Macfarlan | unopposed | |||
United Australia hold | Swing |
Party | Candidate | Votes | % | ±% | |
---|---|---|---|---|---|
Nationalist | Ian Macfarlan | 10,460 | 46.2 | −53.8 | |
Independent | Richard Tracey | 5,141 | 22.7 | +22.7 | |
Independent | Angela Booth | 3,668 | 16.2 | +16.2 | |
Independent | Jeremiah Grant | 3,359 | 14.8 | +14.8 | |
Total formal votes | 22,628 | 97.7 | |||
Informal votes | 535 | 2.3 | |||
Turnout | 23,163 | 94.4 | |||
Nationalist | Ian Macfarlan | 11,342 | 50.1 | ||
Independent | Richard Tracey | 5,750 | 25.4 | ||
Independent | Angela Booth | 5,536 | 24.5 | ||
Nationalist hold | Swing |
Party | Candidate | Votes | % | ±% | |
---|---|---|---|---|---|
Labor | William Finlayson | 4,262 | 22.6 | ||
Independent | Eleanor Glencross | 3,985 | 21.1 | ||
Nationalist | Ian Macfarlan | 3,920 | 20.8 | ||
Nationalist | Henry Abbott | 1,554 | 8.2 | ||
Nationalist | Alfred Kelly | 1,445 | 7.7 | ||
Nationalist | James Ramsay | 1,280 | 6.8 | ||
Nationalist | Henry Hall | 1,037 | 5.5 | ||
Australian Liberal | Daniel Hoban | 823 | 4.4 | ||
Independent | Martin Hannah | 340 | 1.8 | ||
Independent | Thomas Ryan | 193 | 1.0 | ||
Total formal votes | 18,839 | 93.8 | |||
Informal votes | 1,243 | 6.2 | |||
Turnout | 20,082 | 88.6 | |||
Two-candidate-preferred result | |||||
Nationalist | Ian Macfarlan | 9,685 | 51.4 | ||
Independent | Eleanor Glencross | 9,154 | 48.6 | ||
Nationalist gain from Ind. Nationalist | Swing | N/A |
Party | Candidate | Votes | % | ±% | |
---|---|---|---|---|---|
Ind. Nationalist | Oswald Snowball | unopposed | |||
Member changed to Ind. Nationalist from Australian Liberal | Swing | N/A |
Party | Candidate | Votes | % | ±% | |
---|---|---|---|---|---|
Australian Liberal | Oswald Snowball | 10,692 | 64.6 | +64.6 | |
Nationalist | Henry Crowther | 5,869 | 35.4 | −64.6 | |
Total formal votes | 16.561 | 99.5 | |||
Informal votes | 88 | 0.5 | |||
Turnout | 16,649 | 54.5 | |||
Member changed to Australian Liberal from Nationalist | Swing | N/A |
Party | Candidate | Votes | % | ±% | |
---|---|---|---|---|---|
Nationalist | Oswald Snowball | unopposed | |||
Nationalist hold | Swing |
Party | Candidate | Votes | % | ±% | |
---|---|---|---|---|---|
Nationalist | Oswald Snowball | 8,658 | 64.9 | −9.0 | |
Nationalist | Robert Stephenson | 4,685 | 35.1 | +35.1 | |
Total formal votes | 13,343 | 94.0 | −2.7 | ||
Informal votes | 851 | 6.0 | +2.7 | ||
Turnout | 14,194 | 54.7 | +6.7 | ||
Nationalist hold | Swing | N/A |
Party | Candidate | Votes | % | ±% | |
---|---|---|---|---|---|
Nationalist | Oswald Snowball | 7,442 | 73.9 | +1.6 | |
Labor | Arthur Roth | 1,814 | 18.0 | −9.7 | |
Nationalist | Frederick Leveson | 815 | 8.1 | +8.1 | |
Total formal votes | 10,071 | 96.7 | −1.4 | ||
Informal votes | 345 | 3.3 | +1.4 | ||
Turnout | 10,416 | 48.0 | +6.8 | ||
Two-party-preferred result | |||||
Nationalist | Oswald Snowball | 80.3 | +8.0 | ||
Labor | Arthur Roth | 19.7 | −8.0 | ||
Nationalist hold | Swing | +8.0 |
Party | Candidate | Votes | % | ±% | |
---|---|---|---|---|---|
Liberal | Oswald Snowball | 5,348 | 72.3 | −27.7 | |
Labor | Albert Andrews | 2,048 | 27.7 | +27.7 | |
Total formal votes | 7,396 | 98.1 | |||
Informal votes | 144 | 1.9 | |||
Turnout | 7,540 | 41.2 | |||
Liberal hold | Swing | N/A |
Party | Candidate | Votes | % | ±% | |
---|---|---|---|---|---|
Liberal | Oswald Snowball | unopposed | |||
Liberal hold | Swing |
Party | Candidate | Votes | % | ±% | |
---|---|---|---|---|---|
Liberal | Oswald Snowball | 3,362 | 60.3 | −39.7 | |
Independent Liberal | John Hamilton | 1,170 | 31.8 | +31.8 | |
Labor | Daniel McNamara | 439 | 7.9 | +7.9 | |
Total formal votes | 3,571 | 99.94 | N/A | ||
Informal votes | 35 | 0.06 | N/A | ||
Turnout | 3,606 | 72.1 | N/A | ||
Liberal hold | Swing |
The electoral district of Thomastown is an electorate of the Victorian Legislative Assembly. It currently includes the suburbs of Lalor and Thomastown, and parts of Fawkner, Reservoir and Wollert, and has been in existence since 1985.
The electoral district of Evelyn is an electorate of the Victorian Legislative Assembly covering the urban fringe north east of Melbourne. It was first proclaimed in 1859.
The electoral district of Brighton is an electoral district of the Victorian Legislative Assembly. It covers an area of 20 square kilometres (7.7 sq mi) in south-eastern Melbourne, including the suburbs of Brighton and Elwood, and parts of Brighton East and Hampton. It lies within the Southern Metropolitan Region of the upper house, the Legislative Council.
The electoral district of Lowan is a rural Victorian Legislative Assembly electoral district of the Victorian Parliament. It is located within the Western Victoria Region of the Legislative Council. It was initially created by the Electoral Act Amendment Act 1888, taking effect at the 1889 elections. It is the state’s biggest electorate by area, covering about 41,858 km².
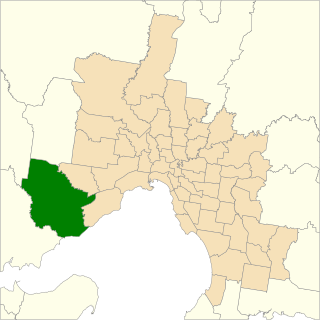
The electoral district of Werribee is an electoral district of the Legislative Assembly in the Australian state of Victoria. It has existed in two incarnations, first from 1976 to 2002, and was created again in the 2013 redistribution and came into effect at the 2014 state election.
This is a list of electoral results for the Electoral district of Broadmeadows in Victorian state elections.
This is a list of electoral results for the district of Bendigo East in Victorian state elections.
This is a list of electoral results for the Electoral district of Box Hill in Victorian state elections.
This is a list of electoral results for the Electoral district of Brunswick in Victorian state elections.
This is a list of electoral results for the Electoral district of Dandenong in Victorian state elections.
This is a list of electoral results for the district of Hawthorn in Victorian state elections.
This is a list of electoral results for the Electoral district of Kew in Victorian state elections.
This is a list of electoral results for the Electoral district of Melbourne in Victorian state elections.
This is a list of electoral results for the Electoral district of Williamstown in Victorian state elections.
This is a list of electoral results for the electoral district of Berwick in Victorian state elections.
The electoral district of Murray Plains is an electoral district of the Victorian Legislative Assembly in Australia. It was created in the redistribution of electoral boundaries in 2013, and came into effect at the 2014 state election.
The Electoral district of Laverton is an electoral district of the Victorian Legislative Assembly in Australia. It was created in the redistribution of electoral boundaries in 2021, and came into effect at the 2022 Victorian state election.
The electoral district of Greenvale is an electoral district of the Victorian Legislative Assembly in Australia. It was created in the redistribution of electoral boundaries in 2021, and came into effect at the 2022 Victorian state election.
The Electoral district of Kalkallo is an electoral district of the Victorian Legislative Assembly in Australia. It was created in the redistribution of electoral boundaries in 2021, and came into effect at the 2022 Victorian state election.
This is a list of electoral results for the Electoral district of Greenvale in Victorian state elections.