Related Research Articles

Fisher was an electoral district of the House of Assembly in the Australian state of South Australia. It was created in 1970 and named after Sir James Fisher, a colonial politician and the first mayor of Adelaide. It was abolished in a 2016 redistribution and its last MP, Nat Cook was elected to represent its replacement, Hurtle Vale, at the 2018 state election. It covers a 94.2 km2 suburban and semi rural area on the southern fringes of Adelaide, taking in the suburbs of Aberfoyle Park, Chandlers Hill, Cherry Gardens, Coromandel East, Happy Valley, Reynella East and parts of Clarendon, O'Halloran Hill and Woodcroft.

Cranbourne is an electoral district of the Victorian Legislative Assembly. It is located south-east of Melbourne and includes the suburbs of Botanic Ridge, Cranbourne, Cranbourne East, Cranbourne North, Cranbourne West, Junction Village, as well as parts of Clyde, Clyde North, Cranbourne South, Devon Meadows, Lynbrook and Lyndhurst. It was created prior to the 1992 state election.

The electoral district of Narre Warren North is an electorate of the Victorian Legislative Assembly and includes the suburbs of Hallam, Narre Warren, Narre Warren North and parts of Berwick, Endeavour Hills and Harkaway.

The electoral district of Eltham is an electoral district of the Victorian Legislative Assembly. It is an outer metropolitan electorate and contains Eltham, Lower Plenty as well as parts of Greensborough and Kangaroo Ground.

The electoral district of Yan Yean is an electoral district of the Victorian Legislative Assembly. It is located on the fringes of Melbourne's northern suburbs and contains the towns of Hurstbridge, Plenty, Whittlesea and Yan Yean.
The electoral district of Ferntree Gully was an electorate of the Victorian Legislative Assembly. It was created in 2002 as a replacement for the abolished electorate of Knox.

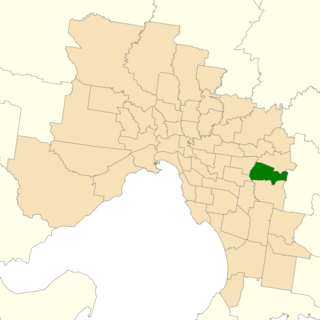
The electoral district of Mount Waverley was an electoral district of the Victorian Legislative Assembly. It was located in the south-eastern suburbs of Melbourne and contained the suburbs of Glen Waverley and Mount Waverley.

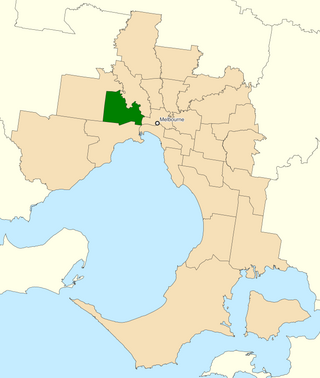
The electoral district of Kororoit is an electorate of the Victorian Legislative Assembly covering Albanvale, Caroline Springs as well as some parts of Deer Park and St Albans in the western suburbs of Melbourne.

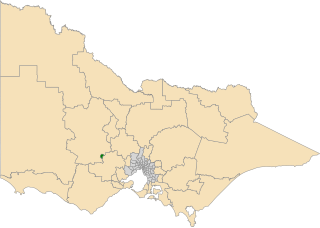
Ripon is a single member electoral district of the Victorian Legislative Assembly. It is a rural electorate based in western Victoria. In 1946 the electoral district of Ripon was first contested but then abolished in the 1955 election after being held by Labor for seven of these years. Ripon was re-created in 1976, essentially as a replacement for Hampden and Kara Kara.

The 2009 Queensland state election was held on 21 March 2009 to elect all 89 members of the Legislative Assembly, a unicameral parliament.

The 2014 Victorian state election, held on Saturday, 29 November 2014, was for the 58th Parliament of Victoria. All 88 seats in the Victorian Legislative Assembly and 40 seats in the Victorian Legislative Council were up for election. The incumbent centre-right Coalition minority government, led by Liberal Party leader and Premier Denis Napthine and National Party leader and Deputy Premier Peter Ryan, was defeated by the centre-left Labor Party opposition, led by Daniel Andrews. The Greens won two lower house seats, their first Legislative Assembly seats in a Victorian state election, whilst increasing their share of upper house seats. The new Andrews Ministry was sworn in on 4 December 2014.
This is a list of electoral results for the Electoral district of Melbourne in Victorian state elections.
This is a list of electoral results for the Electoral district of Preston in Victorian state elections.
The following is a Mackerras pendulum for the 2014 Victorian state election.
The electoral district of Wendouree is an electoral district of the Victorian Legislative Assembly in Australia. It was created in the redistribution of electoral boundaries in 2013, and came into effect at the 2014 state election.
The Division of Spence is an electoral district for the Australian House of Representatives. It is located in the outer northern suburbs of Adelaide in South Australia.

The Division of Macnamara is an Australian Electoral Division in the state of Victoria, which was contested for the first time at the 2019 federal election. The division is named in honour of Dame Jean Macnamara, a doctor and medical researcher who specialised in the polio virus and was involved in children's health initiatives.
The Division of Fraser is an Australian electoral division in the state of Victoria, which was contested for the first time at the 2019 federal election.
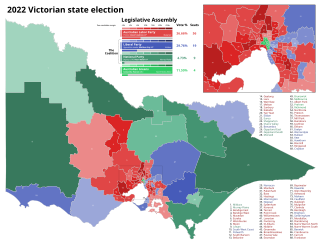
The 2022 Victorian state election was held on Saturday, 26 November 2022 to elect the 60th Parliament of Victoria. All 88 seats in the Legislative Assembly and all 40 seats in the Legislative Council were up for election at the time the writs were issued, however the election in the district of Narracan was deferred due to the death of a candidate.

The 2026 Victorian state election is expected to be held on 28 November 2026 to elect the 61st Parliament of Victoria. All 88 seats in the Legislative Assembly and all 40 seats in the Legislative Council will be up for election, presuming there are no new electorates added in a redistribution.
References
- "Ripon District results". Victorian Electoral Commission. Archived from the original on 21 March 2012. Retrieved 21 November 2011.
- ↑ Wilson, Amber. "De Santis' lawyer says she should've won Ripon: court". Collie Mail.
- ↑ Ripon District results, Victorian Electoral Commission. Retrieved 1 December 2022.
- ↑ State Election 2018: Ripon District, VEC.
- ↑ State Election 2014: Ripon District, VEC.