This is a list of electoral results for the Electoral district of Gippsland South in Victorian state elections.
Member | Party | Term | |
---|---|---|---|
Angus McMillan | Unaligned | 1859–1860 | |
George Hedley | Unaligned | 1859–1860 | |
John Johnson | Unaligned | 1862–1864 | |
Peter Snodgrass | Unaligned | 1864–1867 | |
Thomas McCombie | Unaligned | 1867–1869 | |
George Macartney | Unaligned | 1869–1871 | |
Francis Mason | Unaligned | 1871–1877 | |
George Macartney | Unaligned | 1877–1878 | |
Francis Mason | Unaligned | 1878–1886 | |
Arthur Groom | Unaligned | 1886–1889 | |
Francis Mason | Unaligned | 1889–1902 | |
Thomas Livingston | Ministerialist | 1902–1922 | |
Commonwealth Liberal | |||
Nationalist | |||
Walter West | Nationalist | 1922–1927 | |
Henry Bodman | Independent | 1927 | |
Walter West | Nationalist | 1927–1929 | |
Sir Herbert Hyland | Country | 1929–1970 | |
James Taylor | Liberal | 1970–1973 | |
Neil McInnes | National | 1973–1982 | |
Liberal | |||
Tom Wallace | National | 1982–1992 | |
Peter Ryan | National | 1992–2015 | |
Danny O'Brien | National | 2015–present |
Party | Candidate | Votes | % | ±% | |
---|---|---|---|---|---|
National | Danny O'Brien | 22,566 | 53.3 | −5.3 | |
Labor | Denise Ryan | 9,920 | 23.4 | −4.8 | |
Greens | Jay Tiziani-Simpson | 3,538 | 8.3 | −0.9 | |
Independent | Clay Esler | 2,414 | 5.7 | +5.7 | |
Freedom | Angela Newnham | 1,357 | 3.2 | +3.2 | |
Animal Justice | Helen Jeges | 1,350 | 3.2 | +3.2 | |
Family First | Paul Furlong | 1,218 | 2.9 | +2.9 | |
Total formal votes | 42,363 | 94.7 | +0.4 | ||
Informal votes | 2,354 | 5.3 | −0.4 | ||
Turnout | 44,717 | 90.0 | |||
Two-party-preferred result | |||||
National | Danny O'Brien | 27,645 | 65.2 | +1.2 | |
Labor | Denise Ryan | 14,723 | 34.8 | −1.2 | |
National hold | Swing | +1.2 | |||
Party | Candidate | Votes | % | ±% | |
---|---|---|---|---|---|
National | Danny O'Brien | 22,813 | 61.9 | +4.6 | |
Labor | Denise Ryan | 10,464 | 28.4 | +6.5 | |
Greens | Ian Onley | 3,573 | 9.7 | +0.1 | |
Total formal votes | 36,850 | 94.5 | −0.0 | ||
Informal votes | 2,131 | 5.5 | +0.0 | ||
Turnout | 38,981 | 91.6 | −2.9 | ||
Two-party-preferred result | |||||
National | Danny O'Brien | 24,110 | 65.3 | −0.4 | |
Labor | Denise Ryan | 12,797 | 34.7 | +0.4 | |
National hold | Swing | -0.4 | |||
Party | Candidate | Votes | % | ±% | |
---|---|---|---|---|---|
National | Danny O'Brien | 15,101 | 45.2 | −12.0 | |
Liberal | Scott Rossetti | 8,873 | 26.6 | +26.6 | |
Greens | Andrea Millsom | 5,244 | 15.7 | +6.1 | |
Independent | Deb Meester | 1,151 | 3.4 | +3.4 | |
Independent | Warren Sanders | 1,126 | 3.4 | +3.4 | |
Independent | Viv Pepper | 1,108 | 3.3 | +3.3 | |
Liberal Democrats | Jim McDonald | 449 | 1.3 | +1.3 | |
Independent | Gerard J. Donohue | 330 | 1.0 | +1.0 | |
Total formal votes | 33,382 | 94.5 | −0.0 | ||
Informal votes | 1,946 | 5.5 | +0.0 | ||
Turnout | 35,328 | 86.9 | −7.1 | ||
National | Danny O'Brien | 17,019 | 51.0 | n/a | |
Liberal | Scott Rossetti | 9,509 | 28.5 | n/a | |
Greens | Andrea Millsom | 6,854 | 20.5 | n/a | |
National hold | Swing | n/a | |||
Party | Candidate | Votes | % | ±% | |
---|---|---|---|---|---|
National | Peter Ryan | 20,468 | 57.3 | −6.6 | |
Labor | Lynn Psaila | 7,819 | 21.9 | +3.0 | |
Greens | Ian Onley | 3,436 | 9.6 | −0.3 | |
Country Alliance | Deb Meester | 1,853 | 5.2 | −2.2 | |
Independent | Phil Piper | 1,093 | 3.1 | +3.1 | |
Rise Up Australia | Patrick Winterton | 1,076 | 3.0 | +3.0 | |
Total formal votes | 35,745 | 94.5 | −1.1 | ||
Informal votes | 2,082 | 5.5 | +1.1 | ||
Turnout | 37,827 | 94.0 | +1.2 | ||
Two-party-preferred result | |||||
National | Peter Ryan | 23,503 | 65.7 | −6.9 | |
Labor | Lynn Psaila | 12,289 | 34.3 | +6.9 | |
National hold | Swing | −6.9 | |||
Party | Candidate | Votes | % | ±% | |
---|---|---|---|---|---|
National | Peter Ryan | 22,479 | 63.82 | +22.36 | |
Labor | Steve Boyce | 6,647 | 18.87 | −3.37 | |
Greens | Kate Jackson | 3,495 | 9.92 | +3.26 | |
Country Alliance | John Hirt | 2,602 | 7.39 | +7.39 | |
Total formal votes | 35,223 | 95.62 | +0.24 | ||
Informal votes | 1,615 | 4.38 | −0.24 | ||
Turnout | 36,838 | 93.94 | +0.30 | ||
Two-party-preferred result | |||||
National | Peter Ryan | 25,573 | 72.59 | +6.86 | |
Labor | Steve Boyce | 9,655 | 27.41 | −6.86 | |
National hold | Swing | +6.86 | |||
Party | Candidate | Votes | % | ±% | |
---|---|---|---|---|---|
National | Peter Ryan | 13,818 | 41.5 | +2.8 | |
Labor | Steve Boyce | 7,413 | 22.2 | −6.3 | |
Liberal | Simon Wilson | 6,100 | 18.3 | −2.8 | |
Independent | Jo McCubbin | 2,281 | 6.8 | +6.8 | |
Greens | Jackie Dargaville | 2,221 | 6.7 | −5.0 | |
Family First | Clare Heath | 1,357 | 4.1 | +4.1 | |
Citizens Electoral Council | Theo Alblas | 135 | 0.4 | +0.4 | |
Total formal votes | 33,325 | 95.4 | −1.6 | ||
Informal votes | 1,615 | 4.6 | +1.6 | ||
Turnout | 34,940 | 93.6 | |||
Two-party-preferred result | |||||
National | Peter Ryan | 21,932 | 65.8 | +4.9 | |
Labor | Steve Boyce | 11,393 | 34.2 | −4.9 | |
National hold | Swing | +4.9 | |||
Party | Candidate | Votes | % | ±% | |
---|---|---|---|---|---|
National | Peter Ryan | 12,891 | 38.7 | −4.6 | |
Labor | Gregg Cook | 9,505 | 28.5 | −0.8 | |
Liberal | Jim Forbes | 7,015 | 21.1 | +14.4 | |
Greens | Chris Aitken | 3,905 | 11.7 | +11.7 | |
Total formal votes | 33,316 | 97.0 | −0.5 | ||
Informal votes | 1,027 | 3.0 | +0.5 | ||
Turnout | 34,343 | 94.1 | |||
Two-party-preferred result | |||||
National | Peter Ryan | 20,274 | 60.9 | +2.9 | |
Labor | Gregg Cook | 13,042 | 39.1 | −2.9 | |
National hold | Swing | +2.9 | |||
Party | Candidate | Votes | % | ±% | |
---|---|---|---|---|---|
National | Peter Ryan | 15,130 | 50.5 | −17.2 | |
Labor | Howard Emanuel | 9,955 | 33.2 | +4.7 | |
Independent | Mal Sayers | 4,411 | 14.7 | +14.7 | |
Natural Law | Rohin Clarke | 456 | 1.5 | −2.2 | |
Total formal votes | 29,952 | 97.4 | −0.9 | ||
Informal votes | 800 | 2.6 | +0.9 | ||
Turnout | 30,752 | 93.9 | |||
Two-party-preferred result | |||||
National | Peter Ryan | 17,238 | 57.5 | −11.9 | |
Labor | Howard Emanuel | 12,740 | 42.5 | +11.9 | |
National hold | Swing | -11.9 | |||
Party | Candidate | Votes | % | ±% | |
---|---|---|---|---|---|
National | Peter Ryan | 20,747 | 67.7 | +2.4 | |
Labor | Jim Walton | 8,739 | 28.5 | +5.4 | |
Natural Law | Colin Barnes | 1,151 | 3.8 | +3.8 | |
Total formal votes | 30,637 | 98.3 | +0.5 | ||
Informal votes | 538 | 1.7 | −0.5 | ||
Turnout | 31,175 | 94.6 | |||
Two-party-preferred result | |||||
National | Peter Ryan | 21,258 | 69.4 | −4.5 | |
Labor | Jim Walton | 9,353 | 30.6 | +4.5 | |
National hold | Swing | -4.5 | |||
Party | Candidate | Votes | % | ±% | |
---|---|---|---|---|---|
National | Peter Ryan | 19,879 | 65.3 | +17.2 | |
Labor | Brian Burleigh | 7,035 | 23.1 | −3.1 | |
Independent | Roger Stephens | 2,596 | 8.5 | +8.5 | |
Independent | Vaughan Wareham | 934 | 3.1 | +3.1 | |
Total formal votes | 30,444 | 97.7 | −0.3 | ||
Informal votes | 706 | 2.3 | +0.3 | ||
Turnout | 31,150 | 95.2 | |||
Two-party-preferred result | |||||
National | Peter Ryan | 22,490 | 73.9 | +2.9 | |
Labor | Brian Burleigh | 7,937 | 26.1 | −2.9 | |
National hold | Swing | +2.9 | |||
Party | Candidate | Votes | % | ±% | |
---|---|---|---|---|---|
National | Tom Wallace | 13,951 | 48.00 | −0.93 | |
Labor | Keith Vardy | 7,845 | 26.99 | +1.57 | |
Liberal | Anne-Marie McBeath | 6,562 | 22.58 | −3.07 | |
Call to Australia | Leslie Howlett | 709 | 2.44 | +2.44 | |
Total formal votes | 29,067 | 97.99 | −0.47 | ||
Informal votes | 596 | 2.01 | +0.47 | ||
Turnout | 29,663 | 93.18 | +0.12 | ||
Two-party-preferred result | |||||
National | Tom Wallace | 20,375 | 70.17 | +1.90 | |
Labor | Keith Vardy | 8,662 | 29.83 | +29.83 | |
National hold | Swing | +1.90 | |||
Party | Candidate | Votes | % | ±% | |
---|---|---|---|---|---|
National | Tom Wallace | 13,592 | 48.9 | +16.4 | |
Liberal | Neil McInnes | 7,125 | 25.6 | −10.3 | |
Labor | Max Semken | 7,061 | 25.4 | −0.6 | |
Total formal votes | 27,778 | 98.5 | |||
Informal votes | 435 | 1.5 | |||
Turnout | 28,213 | 93.1 | |||
Two-party-preferred result | |||||
National | Tom Wallace | 19,945 | 71.8 | +3.5 | |
Labor | Max Semken | 7,833 | 28.2 | −3.5 | |
Two-candidate-preferred result | |||||
National | Tom Wallace | 18,960 | 68.3 | ||
Liberal | Neil McInnes | 8,812 | 31.7 | ||
National hold | Swing | ||||
Party | Candidate | Votes | % | ±% | |
---|---|---|---|---|---|
Liberal | Neil McInnes | 9,269 | 36.0 | −1.4 | |
National | Tom Wallace | 8,224 | 32.0 | +1.7 | |
Labor | Reginald Smith | 6,734 | 26.2 | +2.7 | |
Democrats | Wilma Western | 1,492 | 5.8 | −3.0 | |
Total formal votes | 25,719 | 98.2 | +0.9 | ||
Informal votes | 462 | 1.8 | −0.9 | ||
Turnout | 26,181 | 93.8 | +0.9 | ||
Two-party-preferred result | |||||
National | Tom Wallace | 17,836 | 69.3 | +2.2 | |
Labor | Reginald Smith | 7,883 | 30.7 | −2.2 | |
Two-candidate-preferred result | |||||
National | Tom Wallace | 15,068 | 58.6 | +1.7 | |
Liberal | Neil McInnes | 10,651 | 41.4 | −1.7 | |
National hold | Swing | +1.7 | |||
Party | Candidate | Votes | % | ±% | |
---|---|---|---|---|---|
Liberal | David Kallady | 8,998 | 37.4 | +8.3 | |
National | Neil McInnes | 7,293 | 30.3 | −15.2 | |
Labor | Ronald Neal | 5,660 | 23.5 | +2.7 | |
Democrats | Wilma Western | 2,110 | 8.8 | +8.8 | |
Total formal votes | 24,061 | 97.3 | −0.8 | ||
Informal votes | 657 | 2.7 | +0.8 | ||
Turnout | 24,718 | 92.9 | −0.7 | ||
Two-party-preferred result | |||||
National | Neil McInnes | 16,142 | 67.1 | −9.0 | |
Labor | Ronald Neal | 7,919 | 32.9 | +9.0 | |
Two-candidate-preferred result | |||||
National | Neil McInnes | 13,688 | 56.9 | +5.6 | |
Liberal | David Kallady | 10,373 | 43.1 | −5.6 | |
National hold | Swing | +5.6 | |||
Party | Candidate | Votes | % | ±% | |
---|---|---|---|---|---|
National | Neil McInnes | 10,611 | 45.5 | +15.1 | |
Liberal | David Kallady | 6,797 | 29.1 | −10.0 | |
Labor | Russel Wilson | 4,851 | 20.8 | −2.6 | |
Democratic Labor | Leonard Carroll | 1,083 | 4.6 | −2.5 | |
Total formal votes | 23,342 | 98.1 | |||
Informal votes | 439 | 1.9 | |||
Turnout | 23,781 | 93.6 | |||
Two-candidate-preferred result | |||||
National | Neil McInnes | 11,964 | 51.3 | −1.0 | |
Liberal | David Kallady | 11,378 | 48.7 | +1.0 | |
National hold | Swing | -1.0 | |||
Party | Candidate | Votes | % | ±% | |
---|---|---|---|---|---|
Liberal | James Taylor | 8,377 | 41.4 | +14.3 | |
Country | Neil McInnes | 5,962 | 29.4 | −8.3 | |
Labor | Russel Wilson | 4,380 | 21.6 | −1.2 | |
Democratic Labor | John Condon | 1,527 | 7.5 | −4.9 | |
Total formal votes | 20,246 | 97.9 | +0.2 | ||
Informal votes | 429 | 2.1 | −0.2 | ||
Turnout | 20,675 | 93.5 | −1.0 | ||
Two-candidate-preferred result | |||||
Country | Neil McInnes | 10,129 | 50.03 | +6.4 | |
Liberal | James Taylor | 10,117 | 49.97 | −6.4 | |
Country gain from Liberal | Swing | +6.4 | |||
Party | Candidate | Votes | % | ±% | |
---|---|---|---|---|---|
Country | John Vinall | 6,886 | 37.7 | −19.6 | |
Liberal | James Taylor | 4,944 | 27.1 | +14.8 | |
Labor | Thomas Matthews | 4,160 | 22.8 | +4.7 | |
Democratic Labor | John Condon | 2,252 | 12.4 | +1.3 | |
Total formal votes | 18,242 | 97.7 | +1.1 | ||
Informal votes | 437 | 2.3 | −1.1 | ||
Turnout | 18,679 | 94.5 | +1.1 | ||
Two-party-preferred result | |||||
Liberal | James Taylor | 12,904 | 70.7 | −7.7 | |
Labor | Thomas Matthews | 5,338 | 29.3 | +7.7 | |
Two-candidate-preferred result | |||||
Liberal | James Taylor | 10,273 | 56.3 | +56.3 | |
Country | John Vinall | 7,969 | 43.7 | −34.7 | |
Liberal gain from Country | Swing | N/A | |||
Party | Candidate | Votes | % | ±% | |
---|---|---|---|---|---|
Country | Herbert Hyland | 9,716 | 57.3 | −13.4 | |
Labor | Derek Amos | 3,075 | 18.1 | +18.1 | |
Liberal | Harold Suter | 2,094 | 12.3 | −2.2 | |
Democratic Labor | Geoffrey Farrell | 1,888 | 11.1 | −3.7 | |
Independent | John Mansfield | 119 | 0.7 | +0.7 | |
Independent | John Routledge | 69 | 0.4 | +0.4 | |
Total formal votes | 16,961 | 96.6 | |||
Informal votes | 587 | 3.4 | |||
Turnout | 17,548 | 93.4 | |||
Two-party-preferred result | |||||
Country | Herbert Hyland | 13,299 | 78.4 | +4.7 | |
Labor | Derek Amos | 3,662 | 21.6 | +21.6 | |
Country hold | Swing | +4.7 | |||
Party | Candidate | Votes | % | ±% | |
---|---|---|---|---|---|
Country | Herbert Hyland | 16,090 | 70.4 | +15.1 | |
Democratic Labor | Geoffrey Farrell | 3,492 | 15.3 | +1.7 | |
Liberal and Country | Peter Martin | 3,275 | 14.3 | +4.3 | |
Total formal votes | 22,857 | 97.7 | +0.5 | ||
Informal votes | 546 | 2.3 | −0.5 | ||
Turnout | 23,403 | 94.5 | +0.1 | ||
Two-candidate-preferred result | |||||
Country | Herbert Hyland | 17,728 | 77.6 | +0.9 | |
Democratic Labor | Geoffrey Farrell | 5,129 | 22.4 | +22.4 | |
Country hold | Swing | -2.7 | |||
Party | Candidate | Votes | % | ±% | |
---|---|---|---|---|---|
Country | Herbert Hyland | 11,879 | 55.3 | −21.5 | |
Labor | Albert Thexton | 4,181 | 19.5 | +19.5 | |
Democratic Labor | Geoffrey Farrell | 2,918 | 13.6 | −9.6 | |
Liberal and Country | Leslie Horsfield | 2,156 | 10.0 | +10.0 | |
Independent | Bryan Fitzgerald | 340 | 1.6 | +1.6 | |
Total formal votes | 21,474 | 97.2 | −0.6 | ||
Informal votes | 626 | 2.8 | +0.6 | ||
Turnout | 22,100 | 94.4 | −0.5 | ||
Two-party-preferred result | |||||
Country | Herbert Hyland | 16,471 | 76.7 | −0.1 | |
Labor | Albert Thexton | 5,003 | 23.3 | +23.3 | |
Country hold | Swing | N/A | |||
Party | Candidate | Votes | % | ±% | |
---|---|---|---|---|---|
Country | Herbert Hyland | 15,600 | 76.8 | ||
Democratic Labor | John Hansen | 4,711 | 23.2 | ||
Total formal votes | 20,311 | 97.8 | |||
Informal votes | 466 | 2.2 | |||
Turnout | 20,777 | 94.9 | |||
Country hold | Swing | ||||
Party | Candidate | Votes | % | ±% | |
---|---|---|---|---|---|
Country | Herbert Hyland | unopposed | |||
Country hold | Swing | ||||
Party | Candidate | Votes | % | ±% | |
---|---|---|---|---|---|
Country | Herbert Hyland | 9,899 | 55.1 | −21.5 | |
Labor | Sydney Crofts | 8,071 | 44.9 | +44.9 | |
Total formal votes | 17,970 | 99.0 | −1.7 | ||
Informal votes | 169 | 1.0 | +1.7 | ||
Turnout | 18,150 | 93.8 | −1.3 | ||
Country hold | Swing | N/A | |||
Party | Candidate | Votes | % | ±% | |
---|---|---|---|---|---|
Country | Herbert Hyland | 11,544 | 76.6 | +7.4 | |
Liberal and Country | Davy Bertram | 3,525 | 23.4 | +23.4 | |
Total formal votes | 15,069 | 97.3 | −1.9 | ||
Informal votes | 410 | 2.7 | +1.9 | ||
Turnout | 15,479 | 95.1 | 0.0 | ||
Country hold | Swing | N/A | |||
Party | Candidate | Votes | % | ±% | |
---|---|---|---|---|---|
Country | Herbert Hyland | 9,648 | 69.2 | +6.2 | |
Labor | Percy Vagg | 4,294 | 30.8 | −6.2 | |
Total formal votes | 13,942 | 99.2 | 0.0 | ||
Informal votes | 105 | 0.8 | 0.0 | ||
Turnout | 14,047 | 95.1 | +5.4 | ||
Country hold | Swing | +6.2 | |||
Party | Candidate | Votes | % | ±% | |
---|---|---|---|---|---|
Country | Herbert Hyland | 7,788 | 63.0 | ||
Labor | Cecil Shellew | 4,576 | 37.0 | ||
Total formal votes | 12,364 | 99.2 | |||
Informal votes | 94 | 0.8 | |||
Turnout | 12,458 | 89.7 | |||
Country hold | Swing | ||||
Party | Candidate | Votes | % | ±% | |
---|---|---|---|---|---|
Country | Herbert Hyland | 9,372 | 83.5 | −16.5 | |
Independent | Maurice Manning | 1,853 | 16.5 | +16.5 | |
Total formal votes | 11,225 | 98.7 | |||
Informal votes | 148 | 1.3 | |||
Turnout | 11,373 | 87.4 | |||
Country hold | Swing | N/A | |||
Party | Candidate | Votes | % | ±% | |
---|---|---|---|---|---|
Country | Herbert Hyland | unopposed | |||
Country hold | Swing | ||||
Party | Candidate | Votes | % | ±% | |
---|---|---|---|---|---|
Country | Herbert Hyland | unopposed | |||
Country hold | Swing | ||||
Party | Candidate | Votes | % | ±% | |
---|---|---|---|---|---|
Country | Herbert Hyland | unopposed | |||
Country hold | Swing | ||||
Party | Candidate | Votes | % | ±% | |
---|---|---|---|---|---|
Country | Herbert Hyland | unopposed | |||
Country hold | Swing | ||||
Party | Candidate | Votes | % | ±% | |
---|---|---|---|---|---|
Country | Herbert Hyland | 4,175 | 43.1 | +17.6 | |
Nationalist | Walter West | 2,900 | 29.9 | −0.5 | |
Labor | Morris Mulcahy | 2,610 | 27.0 | +3.3 | |
Total formal votes | 9,685 | 98.9 | +2.2 | ||
Informal votes | 106 | 1.1 | −2.2 | ||
Turnout | 9,791 | 92.2 | 0.0 | ||
Two-candidate-preferred result | |||||
Country | Herbert Hyland | 5,999 | 61.9 | +61.9 | |
Nationalist | Walter West | 3,686 | 39.1 | −9.3 | |
Country gain from Independent | Swing | N/A | |||
Party | Candidate | Votes | % | ±% | |
---|---|---|---|---|---|
Labor | Michael Buckley | 3,557 | 40.3 | +16.6 | |
Nationalist | Walter West | 2,641 | 29.9 | −0.5 | |
Country | Robert Morley | 1,708 | 19.4 | +3.2 | |
Nationalist | Thomas McGalliard | 538 | 6.1 | +6.1 | |
Independent | George Carter | 380 | 4.3 | +4.3 | |
Total formal votes | 8,824 | 97.8 | +1.1 | ||
Informal votes | 198 | 2.2 | −1.1 | ||
Turnout | 9,022 | 92.0 | +0.2 | ||
Two-party-preferred result | |||||
Nationalist | Walter West | 4,752 | 53.9 | +5.5 | |
Labor | Michael Buckley | 4,072 | 46.1 | +46.1 | |
Nationalist gain from Independent | Swing | N/A | |||
Party | Candidate | Votes | % | ±% | |
---|---|---|---|---|---|
Nationalist | Walter West | 2,727 | 30.4 | ||
Labor | Michael Buckley | 2,126 | 23.7 | ||
Independent | Henry Bodman | 1,821 | 20.3 | ||
Country | Thomas Anderson | 1,448 | 16.2 | ||
Country | David White | 838 | 9.3 | ||
Total formal votes | 8,960 | 96.7 | |||
Informal votes | 303 | 3.3 | |||
Turnout | 9,263 | 92.2 | |||
Two-candidate-preferred result | |||||
Independent | Henry Bodman | 4,621 | 51.6 | ||
Nationalist | Walter West | 4,339 | 48.4 | ||
Independent gain from Nationalist | Swing | ||||
Party | Candidate | Votes | % | ±% | |
---|---|---|---|---|---|
Nationalist | Walter West | unopposed | |||
Nationalist hold | Swing | ||||
Party | Candidate | Votes | % | ±% | |
---|---|---|---|---|---|
Nationalist | Walter West | 2,124 | 39.6 | −23.7 | |
Victorian Farmers | Matthew Boland | 2,017 | 37.6 | +0.9 | |
Ind. Nationalist | Henry York | 1,223 | 22.8 | +22.8 | |
Total formal votes | 5,364 | 98.2 | −1.4 | ||
Informal votes | 101 | 1.8 | +1.4 | ||
Turnout | 5,465 | 56.0 | +7.3 | ||
Two-candidate-preferred result | |||||
Nationalist | Walter West | 2,980 | 55.6 | −7.7 | |
Victorian Farmers | Matthew Boland | 2,384 | 44.4 | +7.7 | |
Nationalist hold | Swing | -7.7 | |||
Party | Candidate | Votes | % | ±% | |
---|---|---|---|---|---|
Nationalist | Thomas Livingston | 2,980 | 63.3 | +5.5 | |
Victorian Farmers | David White | 1,725 | 36.7 | −5.5 | |
Total formal votes | 4,705 | 99.6 | +3.0 | ||
Informal votes | 19 | 0.4 | −3.0 | ||
Turnout | 4,724 | 48.7 | −10.7 | ||
Nationalist hold | Swing | +5.5 | |||
Party | Candidate | Votes | % | ±% | |
---|---|---|---|---|---|
Nationalist | Thomas Livingston | 3,212 | 57.8 | +3.3 | |
Victorian Farmers | Thomas McGalliard | 2,346 | 42.2 | +22.5 | |
Total formal votes | 5,558 | 96.6 | −0.5 | ||
Informal votes | 198 | 3.4 | +0.5 | ||
Turnout | 5,756 | 59.4 | +11.8 | ||
Nationalist hold | Swing | N/A | |||
Party | Candidate | Votes | % | ±% | |
---|---|---|---|---|---|
Nationalist | Thomas Livingston | 2,533 | 54.5 | ||
Nationalist | Thomas McGalliard | 1,203 | 25.9 | ||
Victorian Farmers | James McQueen | 915 | 19.7 | ||
Total formal votes | 4,651 | 97.1 | |||
Informal votes | 141 | 2.9 | |||
Turnout | 4,792 | 47.6 | |||
Nationalist hold | Swing | ||||
Party | Candidate | Votes | % | ±% | |
---|---|---|---|---|---|
Liberal | Thomas Livingston | unopposed | |||
Liberal hold | Swing | ||||
Party | Candidate | Votes | % | ±% | |
---|---|---|---|---|---|
Liberal | Thomas Livingston | unopposed | |||
Liberal hold | Swing | ||||
Gippsland is a rural region that makes up the southeastern part of Victoria, Australia, mostly comprising the coastal plains to the rainward (southern) side of the Victorian Alps. It covers an elongated area of 41,556 km2 (16,045 sq mi) located further east of the Shire of Cardinia between Dandenong Ranges and Mornington Peninsula, and is bounded to the north by the mountain ranges and plateaus/highlands of the High Country, to the southwest by the Western Port Bay, to the south and east by the Bass Strait and the Tasman Sea, and to the east and northeast by the Black–Allan Line.
The electoral district of Benambra is one of the electoral districts of Victoria, Australia, for the Victorian Legislative Assembly. It covers an area of 10,037 square kilometres (3,875 sq mi) in north-eastern Victoria. The largest settlement is the city of Wodonga. Benambra also includes the towns of Baranduda, Barnawartha, Beechworth, Chiltern, Corryong, Eskdale, Kiewa, Mitta Mitta, Mount Beauty, Rutherglen, Tallangatta, Tangambalanga, Tawonga, Wahgunyah, and Yackandandah. It lies in the Northern Victoria Region of the upper house, the Legislative Council.
The Electoral district of Rodney was a Victorian Legislative Assembly electorate in Northern Victoria.
The electoral district of Bass is one of the electoral districts of Victoria, Australia, for the Victorian Legislative Assembly. It covers an area of 1,358 square kilometres (524 sq mi) south east of Melbourne, stretching from the satellite suburb of Clyde through rural areas to the coast at Inverloch and Phillip Island. It includes the suburbs and towns of Bass, Cape Paterson, Clyde, Corinella, Cowes, Grantville, Inverloch, Kilcunda, Koo Wee Rup, Lang Lang, Pearcedale, Rhyll, San Remo, Tooradin, Ventnor and Wonthaggi. It lies within the Eastern Victoria Region of the upper house, the Legislative Council.
The electoral district of Albert Park is one of the electoral districts of Victoria, Australia, for the Victorian Legislative Assembly. It covers an area of 21 square kilometres (8.1 sq mi) in inner suburban Melbourne, and includes the suburbs of Albert Park, Middle Park, Port Melbourne, St Kilda West, Southbank, South Melbourne, South Wharf, and parts of St Kilda. It lies within the Southern Metropolitan Region of the upper house, the Legislative Council.
The electoral district of Gippsland East is an electoral district of the Victorian Legislative Assembly. It covers most of eastern Victoria and includes the towns of Bairnsdale, Lakes Entrance, Orbost, Omeo, Maffra and Heyfield. Gippsland East is the state's third largest electorate in area and covers 27,544 square kilometres.
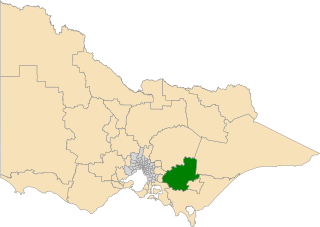
The electoral district of Narracan is an electoral district of the Victorian Legislative Assembly in Australia. It was first proclaimed in 1967 and has usually been held by the Liberal Party.
The electoral district of Morwell is an electoral district of the Victorian Legislative Assembly. It covers the regional centres of Moe, Morwell and Traralgon, as well as the surrounding rural areas in the middle of Gippsland.
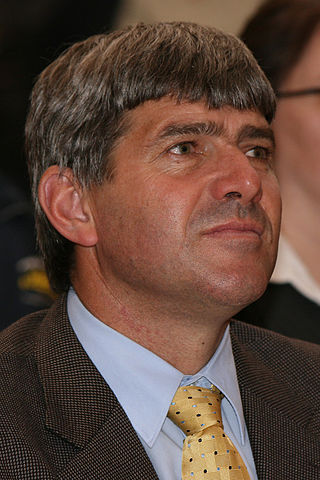
Craig Ingram is a former Australian politician, and was the Independent Member of Parliament for Gippsland East in the Victorian Legislative Assembly from 1999 to 2010. In 2012 he was appointed as executive officer for the Amateur Fisherman's Association of the NT (AFANT).
Eastern Victoria Region is one of the eight electoral regions of Victoria, Australia, which elects five members to the Victorian Legislative Council by proportional representation. The region was created in 2006 following the 2005 reform of the Victorian Legislative Council.
The electoral district of Gippsland South is a Lower House electoral district of the Victorian Parliament. It is located within the Eastern Victoria Region of the Legislative Council.
This is a list of electoral results for the Electoral district of Gippsland East in Victorian state elections.
This is a list of electoral results for the Electoral district of South-West Coast in Victorian state elections.
Gippsland was an electoral district of the Legislative Assembly in the Australian state of Victoria from 1856 to 1859. From 1859, two new districts were created: South Gippsland and North Gippsland.
Gippsland North was an electoral district of the Legislative Assembly in the Australian state of Victoria located in northern Gippsland from 1859 to 1955.
This is a list of members of the Victorian Legislative Assembly from the elections of 26 August – 26 September 1859 to the elections of 2 – 19 August 1861.
A by-election for the seat of Gippsland South in the Victorian Legislative Assembly was held on 14 March 2015. The by-election was triggered by the resignation of former state National Party leader and Deputy Premier, Peter Ryan. Ryan had been a member of the Victorian parliament for over 22 years, and last retained the seat at the 2014 election on a 65.7 percent two-party vote, with a negative 6.9 percentage point swing. The election was contested on the same boundaries used at the previous state election.
This is a list of electoral district results for the 2002 Victorian state election.
This is a list of electoral results for the electoral district of Gippsland North in Victorian state elections.
This is a list of electoral district results for the 2022 Victorian state election for the Legislative Assembly.