This is a list of electoral results for the Electoral district of Essendon in Victorian state elections.
Member | Party | Term | |
---|---|---|---|
William Watt | Liberal | 1904–1914 | |
Maurice Blackburn | Labor | 1914–1917 | |
Thomas Ryan | Nationalist | 1917–1924 | |
Frank Keane | Labor | 1924–1927 | |
Arthur Drakeford | Labor | 1927–1932 | |
James Dillon | United Australia | 1932–1943 | |
Samuel Merrifield | Labor | 1943–1945 | |
Arthur Drakeford Jr | Labor | 1945–1947 | |
Allen Bateman | Liberal | 1947–1950 | |
George Fewster | Labor | 1950–1955 | |
Labor (Anti-Communist) | 1955 | ||
Sir Kenneth Wheeler | Liberal | 1958–1979 | |
Barry Rowe | Labor | 1979–1992 | |
Ian Davis | Liberal | 1992–1996 | |
Judy Maddigan | Labor | 1996–2010 | |
Justin Madden | Labor | 2010–2014 | |
Danny Pearson | Labor | 2014–present |
Party | Candidate | Votes | % | ±% | |
---|---|---|---|---|---|
Labor | Danny Pearson | 17,196 | 41.1 | −5.1 | |
Liberal | Angelo Baronessa | 12,331 | 29.5 | +1.9 | |
Greens | Jared Prentis | 6,344 | 15.1 | −1.7 | |
Victorian Socialists | Daniel Nair Dadich | 1,951 | 4.7 | +4.7 | |
Animal Justice | Gayle Williams | 1,173 | 2.8 | +2.8 | |
Reason | Nicholas Hope | 1,018 | 2.4 | +2.4 | |
Freedom | David Wright | 1,006 | 2.4 | +2.4 | |
Family First | Margaret Muir | 848 | 2.0 | +2.0 | |
Total formal votes | 41,867 | 96.0 | +1.5 | ||
Informal votes | 1,761 | 4.0 | −1.5 | ||
Turnout | 43,628 | 88.1 | |||
Two-party-preferred result | |||||
Labor | Danny Pearson | 26,146 | 62.5 | −3.4 | |
Liberal | Angelo Baronessa | 15,721 | 37.5 | +3.4 | |
Labor hold | Swing | −3.4 | |||
Party | Candidate | Votes | % | ±% | |
---|---|---|---|---|---|
Labor | Danny Pearson | 19,173 | 46.23 | +5.33 | |
Liberal | Gino Potenza | 11,414 | 27.52 | −8.34 | |
Greens | James Williams | 6,971 | 16.81 | −1.22 | |
Independent | Richard Lawrence | 1,702 | 4.10 | +0.72 | |
Independent | Kate Baker | 1,356 | 3.27 | +3.27 | |
Democratic Labour | Dermot Connors | 856 | 2.06 | +2.06 | |
Total formal votes | 41,472 | 95.25 | −0.81 | ||
Informal votes | 2,067 | 4.75 | +0.81 | ||
Turnout | 43,539 | 89.91 | −2.52 | ||
Two-party-preferred result | |||||
Labor | Danny Pearson | 27,315 | 65.86 | +7.20 | |
Liberal | Gino Potenza | 14,157 | 34.14 | −7.20 | |
Labor hold | Swing | +7.20 | |||
Party | Candidate | Votes | % | ±% | |
---|---|---|---|---|---|
Labor | Danny Pearson | 16,026 | 40.9 | +2.8 | |
Liberal | Fred Ackerman | 14,052 | 35.9 | +1.1 | |
Greens | Ashley Waite | 7,065 | 18.0 | +0.1 | |
Independent | Richard Lawrence | 1,326 | 3.4 | +3.4 | |
Voice for the West | Mario Mendez | 714 | 1.8 | +1.8 | |
Total formal votes | 39,183 | 96.1 | +0.1 | ||
Informal votes | 1,605 | 3.9 | −0.1 | ||
Turnout | 40,788 | 92.4 | +2.7 | ||
Two-party-preferred result | |||||
Labor | Danny Pearson | 22,988 | 58.7 | +4.3 | |
Liberal | Fred Ackerman | 16,195 | 41.3 | −4.3 | |
Labor hold | Swing | +4.3 | |||
Party | Candidate | Votes | % | ±% | |
---|---|---|---|---|---|
Liberal | Rebecca Gauci | 12,983 | 36.83 | +3.53 | |
Labor | Justin Madden | 12,867 | 36.50 | −13.37 | |
Greens | Rose Iser | 5,816 | 16.50 | +4.34 | |
Independent | Paul Giuliano | 2,540 | 7.21 | +7.21 | |
Democratic Labor | Sarah Notaro | 1,047 | 2.97 | +2.97 | |
Total formal votes | 35,253 | 95.97 | +0.72 | ||
Informal votes | 1,480 | 4.03 | −0.72 | ||
Turnout | 36,733 | 92.17 | +0.44 | ||
Two-party-preferred result | |||||
Labor | Justin Madden | 18,224 | 51.66 | −10.04 | |
Liberal | Rebecca Gauci | 17,051 | 48.34 | +10.04 | |
Labor hold | Swing | -10.04 | |||
Party | Candidate | Votes | % | ±% | |
---|---|---|---|---|---|
Labor | Judy Maddigan | 16,383 | 49.87 | −4.67 | |
Liberal | Conrad D'Souza | 10,939 | 33.30 | +1.84 | |
Greens | Bob Muntz | 3,995 | 12.16 | −0.29 | |
Family First | Arthur Tsiglopoulos | 997 | 3.03 | +3.03 | |
Independent | Philip Cutler | 414 | 1.26 | +1.26 | |
Citizens Electoral Council | Jeremy Beck | 125 | 0.38 | −1.17 | |
Total formal votes | 32,853 | 95.25 | −1.62 | ||
Informal votes | 1,639 | 4.75 | +1.62 | ||
Turnout | 34,492 | 91.73 | −0.73 | ||
Two-party-preferred result | |||||
Labor | Judy Maddigan | 20,276 | 61.70 | −4.22 | |
Liberal | Conrad D'Souza | 12,586 | 38.30 | +4.22 | |
Labor hold | Swing | -4.22 | |||
Party | Candidate | Votes | % | ±% | |
---|---|---|---|---|---|
Labor | Judy Maddigan | 18,255 | 54.5 | −3.6 | |
Liberal | Steve Reynolds | 10,531 | 31.5 | −10.4 | |
Greens | Victor Lewis-Hansom | 4,167 | 12.4 | +12.4 | |
Citizens Electoral Council | Colin Horne | 519 | 1.6 | +1.6 | |
Total formal votes | 33,472 | 96.9 | −0.6 | ||
Informal votes | 1,081 | 3.1 | +0.6 | ||
Turnout | 34,553 | 92.5 | |||
Two-party-preferred result | |||||
Labor | Judy Maddigan | 22,065 | 65.9 | +7.8 | |
Liberal | Steve Reynolds | 11,405 | 34.1 | −7.8 | |
Labor hold | Swing | +7.8 | |||
Party | Candidate | Votes | % | ±% | |
---|---|---|---|---|---|
Labor | Judy Maddigan | 18,489 | 58.5 | +5.1 | |
Liberal | Ken Saunders | 13,135 | 41.5 | −5.1 | |
Total formal votes | 31,624 | 97.4 | −0.3 | ||
Informal votes | 839 | 2.6 | +0.3 | ||
Turnout | 32,463 | 93.7 | |||
Labor hold | Swing | +5.1 | |||
Party | Candidate | Votes | % | ±% | |
---|---|---|---|---|---|
Labor | Judy Maddigan | 15,652 | 50.9 | +6.9 | |
Liberal | Ian Davis | 13,282 | 43.2 | +0.2 | |
Independent | Joan Brodie | 978 | 3.2 | +3.2 | |
Independent | Geoff Lutz | 291 | 0.9 | +0.9 | |
Independent | Simone Green | 288 | 0.9 | +0.9 | |
Natural Law | Jamie Pollock | 263 | 0.9 | −1.3 | |
Total formal votes | 30,754 | 97.7 | +1.4 | ||
Informal votes | 727 | 2.3 | −1.4 | ||
Turnout | 31,481 | 93.3 | |||
Two-party-preferred result | |||||
Labor | Judy Maddigan | 16,404 | 53.4 | +4.6 | |
Liberal | Ian Davis | 14,324 | 46.6 | −4.6 | |
Labor gain from Liberal | Swing | +4.6 | |||
Party | Candidate | Votes | % | ±% | |
---|---|---|---|---|---|
Labor | Judy Maddigan | 13,046 | 44.0 | −10.0 | |
Liberal | Ian Davis | 12,757 | 43.0 | +1.0 | |
Independent | Rowena Allsop | 2,341 | 7.9 | +7.9 | |
Independent | Geoff Ireland | 875 | 3.0 | +3.0 | |
Natural Law | John Bell | 628 | 2.1 | +2.1 | |
Total formal votes | 29,647 | 96.3 | +0.7 | ||
Informal votes | 1,145 | 3.7 | −0.7 | ||
Turnout | 30,792 | 93.8 | |||
Two-party-preferred result | |||||
Liberal | Ian Davis | 15,159 | 51.2 | +6.7 | |
Labor | Judy Maddigan | 14,429 | 48.8 | −6.7 | |
Liberal gain from Labor | Swing | +6.7 | |||
Party | Candidate | Votes | % | ±% | |
---|---|---|---|---|---|
Labor | Barry Rowe | 13,862 | 55.55 | −6.53 | |
Liberal | Thomas Hilbert | 10,404 | 41.70 | +3.78 | |
Call to Australia | Karl Benden | 686 | 2.75 | +2.75 | |
Total formal votes | 24,952 | 95.43 | −1.26 | ||
Informal votes | 1,194 | 4.57 | +1.26 | ||
Turnout | 26,146 | 89.57 | −2.21 | ||
Two-party-preferred result | |||||
Labor | Barry Rowe | 14,156 | 56.74 | −5.34 | |
Liberal | Thomas Hilbert | 10,404 | 43.26 | +5.34 | |
Labor hold | Swing | -5.34 | |||
Party | Candidate | Votes | % | ±% | |
---|---|---|---|---|---|
Labor | Barry Rowe | 16,964 | 62.1 | −1.8 | |
Liberal | Brian Dodgson | 10,360 | 37.9 | +3.7 | |
Total formal votes | 27,324 | 96.7 | |||
Informal votes | 935 | 3.3 | |||
Turnout | 28,259 | 91.8 | |||
Labor hold | Swing | -2.9 | |||
Party | Candidate | Votes | % | ±% | |
---|---|---|---|---|---|
Labor | Barry Rowe | 14,396 | 57.3 | +6.5 | |
Liberal | Graeme Goodson | 9,770 | 38.9 | −2.5 | |
Democrats | Alan Powell | 780 | 3.1 | +3.1 | |
Australia | Richard Wright | 176 | 0.7 | +0.7 | |
Total formal votes | 25,122 | 97.2 | −0.1 | ||
Informal votes | 719 | 2.8 | +0.1 | ||
Turnout | 25,841 | 95.1 | +0.7 | ||
Two-party-preferred result | |||||
Labor | Barry Rowe | 14,932 | 59.4 | +7.9 | |
Liberal | Graeme Goodson | 10,190 | 40.6 | −7.9 | |
Labor hold | Swing | +7.9 | |||
Party | Candidate | Votes | % | ±% | |
---|---|---|---|---|---|
Labor | Barry Rowe | 12,864 | 50.8 | +0.8 | |
Liberal | Ian Hocking | 10,487 | 41.4 | −8.6 | |
Democratic Labor | Richard McManus | 1,993 | 7.9 | +7.9 | |
Total formal votes | 25,344 | 97.3 | +0.1 | ||
Informal votes | 702 | 2.7 | −0.1 | ||
Turnout | 26,046 | 94.4 | +0.5 | ||
Two-party-preferred result | |||||
Labor | Barry Rowe | 13,045 | 51.5 | +1.6 | |
Liberal | Ian Hocking | 12,299 | 48.5 | −1.6 | |
Labor gain from Liberal | Swing | +1.6 | |||
Party | Candidate | Votes | % | ±% | |
---|---|---|---|---|---|
Liberal | Kenneth Wheeler | 13,197 | 50.05 | +8.1 | |
Labor | Barry Rowe | 13,173 | 49.95 | +5.7 | |
Total formal votes | 26,370 | 97.2 | |||
Informal votes | 748 | 2.8 | |||
Turnout | 27,118 | 93.9 | |||
Liberal hold | Swing | -2.8 | |||
Party | Candidate | Votes | % | ±% | |
---|---|---|---|---|---|
Labor | Ronald Kennelly | 11,514 | 42.7 | −3.0 | |
Liberal | Kenneth Wheeler | 11,232 | 41.6 | +4.2 | |
Democratic Labor | John Moloney | 2,483 | 9.2 | −7.6 | |
Australia | Stanley Bell | 1,205 | 4.5 | +4.5 | |
Defence of Government Schools | Lancelot Hutchinson | 555 | 2.1 | +2.1 | |
Total formal votes | 26,989 | 96.0 | −0.8 | ||
Informal votes | 1,113 | 4.0 | +0.8 | ||
Turnout | 28,102 | 95.1 | −0.3 | ||
Two-party-preferred result | |||||
Liberal | Kenneth Wheeler | 14,377 | 53.3 | +2.6 | |
Labor | Ronald Kennelly | 12,612 | 46.7 | −2.6 | |
Liberal hold | Swing | +2.6 | |||
Party | Candidate | Votes | % | ±% | |
---|---|---|---|---|---|
Labor | Ronald Kennelly | 11,137 | 45.7 | +4.5 | |
Liberal | Kenneth Wheeler | 9,125 | 37.4 | −2.1 | |
Democratic Labor | Kevin Digby | 4,103 | 16.8 | −1.7 | |
Total formal votes | 24,365 | 96.8 | −1.4 | ||
Informal votes | 815 | 3.2 | +1.4 | ||
Turnout | 25,180 | 95.4 | −1.2 | ||
Two-party-preferred result | |||||
Liberal | Kenneth Wheeler | 12,342 | 50.7 | −4.7 | |
Labor | Ronald Kennelly | 12,023 | 49.3 | +4.7 | |
Liberal hold | Swing | -4.7 | |||
Party | Candidate | Votes | % | ±% | |
---|---|---|---|---|---|
Labor | Arthur Sanger | 9,624 | 41.2 | −1.2 | |
Liberal | Kenneth Wheeler | 9,216 | 39.5 | +1.1 | |
Democratic Labor | Kevin Digby | 4,315 | 18.5 | −0.8 | |
Independent | Francis Zajac | 181 | 0.8 | +0.8 | |
Total formal votes | 23,986 | 98.2 | |||
Informal votes | 181 | 1.8 | |||
Turnout | 24,167 | 96.6 | |||
Two-party-preferred result | |||||
Liberal | Kenneth Wheeler | 12,929 | 55.4 | +0.5 | |
Labor | Arthur Sanger | 10,407 | 44.6 | −0.5 | |
Liberal hold | Swing | +0.5 | |||
Party | Candidate | Votes | % | ±% | |
---|---|---|---|---|---|
Liberal and Country | Kenneth Wheeler | 9,893 | 41.9 | +2.0 | |
Labor | Richard Kirby | 9,234 | 39.1 | +0.4 | |
Democratic Labor | Kevin Digby | 4,504 | 19.1 | −1.0 | |
Total formal votes | 23,631 | 98.0 | +0.6 | ||
Informal votes | 485 | 2.0 | −0.6 | ||
Turnout | 24,116 | 94.9 | −0.5 | ||
Two-party-preferred result | |||||
Liberal and Country | Kenneth Wheeler | 13,459 | 57.0 | 0.0 | |
Labor | Richard Kirby | 10,172 | 43.0 | 0.0 | |
Liberal and Country hold | Swing | 0.0 | |||
Party | Candidate | Votes | % | ±% | |
---|---|---|---|---|---|
Liberal and Country | Kenneth Wheeler | 9,054 | 39.9 | +1.8 | |
Labor | Leslie Edmunds | 8,794 | 38.7 | −6.2 | |
Democratic Labor | Kevin Digby | 4,564 | 20.1 | +3.0 | |
Independent | Norman McClure | 294 | 1.3 | +1.3 | |
Total formal votes | 22,706 | 97.4 | −1.0 | ||
Informal votes | 614 | 2.6 | +1.0 | ||
Turnout | 23,320 | 95.4 | −0.3 | ||
Two-party-preferred result | |||||
Liberal and Country | Kenneth Wheeler | 12,933 | 57.0 | +5.5 | |
Labor | Leslie Edmunds | 9,773 | 43.0 | −5.5 | |
Liberal and Country hold | Swing | +5.5 | |||
Party | Candidate | Votes | % | ±% | |
---|---|---|---|---|---|
Labor | Arthur Drakeford | 9,737 | 44.9 | ||
Liberal and Country | Kenneth Wheeler | 8,270 | 38.1 | ||
Democratic Labor | Kevin Digby | 3,702 | 17.1 | ||
Total formal votes | 21,709 | 98.4 | |||
Informal votes | 343 | 1.6 | |||
Turnout | 22,052 | 95.7 | |||
Two-party-preferred result | |||||
Liberal and Country | Kenneth Wheeler | 11,181 | 51.5 | ||
Labor | Arthur Drakeford | 10,528 | 48.5 | ||
Liberal and Country gain from Labor | Swing | ||||
Party | Candidate | Votes | % | ±% | |
---|---|---|---|---|---|
Labor | George Fewster | 19,808 | 64.2 | +15.1 | |
Liberal and Country | Kenneth Wheeler | 8,279 | 26.8 | −19.4 | |
Independent | Lancelot Hutchinson | 2,765 | 9.0 | +9.0 | |
Total formal votes | 30,852 | 98.4 | −0.6 | ||
Informal votes | 485 | 1.6 | +0.6 | ||
Turnout | 31,337 | 94.4 | −0.9 | ||
Two-party-preferred result | |||||
Labor | George Fewster | 20,085 | 65.1 | +13.8 | |
Liberal and Country | Kenneth Wheeler | 10,767 | 34.9 | −13.8 | |
Labor hold | Swing | +13.8 | |||
Party | Candidate | Votes | % | ±% | |
---|---|---|---|---|---|
Labor | George Fewster | 13,725 | 49.1 | −0.3 | |
Liberal and Country | Allen Bateman | 12,910 | 46.2 | −4.4 | |
Independent | Arthur Dodds | 1,319 | 4.7 | +4.7 | |
Total formal votes | 27,954 | 99.0 | +0.1 | ||
Informal votes | 287 | 1.0 | −0.1 | ||
Turnout | 28,241 | 95.3 | +0.5 | ||
Two-party-preferred result | |||||
Labor | George Fewster | 14,339 | 51.3 | +1.9 | |
Liberal and Country | Allen Bateman | 13,615 | 48.7 | −1.9 | |
Labor gain from Liberal and Country | Swing | +1.9 | |||
Party | Candidate | Votes | % | ±% | |
---|---|---|---|---|---|
Liberal | Allen Bateman | 12,776 | 50.6 | +14.0 | |
Labor | Arthur Drakeford | 12,464 | 49.4 | −14.0 | |
Total formal votes | 25,240 | 98.9 | +0.9 | ||
Informal votes | 288 | 1.1 | −0.9 | ||
Turnout | 25,528 | 94.8 | +5.1 | ||
Liberal gain from Labor | Swing | +14.0 | |||
Party | Candidate | Votes | % | ±% | |
---|---|---|---|---|---|
Labor | Arthur Drakeford Jr. | 14,007 | 63.4 | ||
Liberal | James Dillon | 8,073 | 36.6 | ||
Total formal votes | 22,080 | 98.0 | |||
Informal votes | 442 | 2.0 | |||
Turnout | 22,522 | 89.7 | |||
Labor hold | Swing | ||||
Party | Candidate | Votes | % | ±% | |
---|---|---|---|---|---|
Labor | Samuel Merrifield | 12,294 | 45.6 | −2.8 | |
United Australia | James Dillon | 11,370 | 42.2 | −9.4 | |
Independent | Arthur Dodds | 3,296 | 12.2 | +12.2 | |
Total formal votes | 26,960 | 97.8 | −1.2 | ||
Informal votes | 591 | 2.2 | +1.2 | ||
Turnout | 27,551 | 89.2 | −6.2 | ||
Two-party-preferred result | |||||
Labor | Samuel Merrifield | 14,239 | 52.8 | +4.4 | |
United Australia | James Dillon | 12,721 | 47.2 | −4.4 | |
Labor gain from United Australia | Swing | +4.4 | |||
Party | Candidate | Votes | % | ±% | |
---|---|---|---|---|---|
United Australia | James Dillon | 12,931 | 51.6 | −3.1 | |
Labor | Arthur Clarey | 12,149 | 48.4 | +3.1 | |
Total formal votes | 25,080 | 99.0 | +0.1 | ||
Informal votes | 261 | 1.0 | −0.1 | ||
Turnout | 25,341 | 95.4 | −1.3 | ||
United Australia hold | Swing | -3.1 | |||
Party | Candidate | Votes | % | ±% | |
---|---|---|---|---|---|
United Australia | James Dillon | 12,999 | 54.7 | +2.9 | |
Labor | Arthur Clarey | 10,752 | 45.3 | −2.9 | |
Total formal votes | 23,751 | 98.9 | −0.3 | ||
Informal votes | 262 | 1.1 | +0.3 | ||
Turnout | 24,013 | 96.7 | +0.3 | ||
United Australia hold | Swing | +2.9 | |||
Party | Candidate | Votes | % | ±% | |
---|---|---|---|---|---|
United Australia | James Dillon | 11,746 | 51.8 | −1.1 | |
Labor | Alan Bird | 10,921 | 48.2 | +1.1 | |
Total formal votes | 22,667 | 99.2 | +0.1 | ||
Informal votes | 193 | 0.8 | −0.1 | ||
Turnout | 22,860 | 96.4 | 0.0 | ||
United Australia hold | Swing | -1.1 | |||
Party | Candidate | Votes | % | ±% | |
---|---|---|---|---|---|
United Australia | James Dillon | 11,572 | 52.9 | +26.8 | |
Labor | Arthur Drakeford | 10,300 | 47.1 | −10.4 | |
Total formal votes | 21,872 | 99.1 | +0.8 | ||
Informal votes | 206 | 0.9 | −0.8 | ||
Turnout | 22,078 | 96.4 | +0.3 | ||
United Australia gain from Labor | Swing | +12.0 | |||
Party | Candidate | Votes | % | ±% | |
---|---|---|---|---|---|
Labor | Arthur Drakeford | 12,119 | 57.5 | +5.1 | |
Nationalist | Arthur Clerke | 5,506 | 26.1 | −21.5 | |
Ind. Nationalist | Arthur Fenton | 2,680 | 12.7 | +12.7 | |
Ind. Nationalist | Gerald Fitzgerald | 775 | 3.7 | +3.7 | |
Total formal votes | 21,080 | 98.3 | −1.0 | ||
Informal votes | 368 | 1.7 | +1.0 | ||
Turnout | 21,448 | 96.1 | +1.3 | ||
Two-party-preferred result | |||||
Labor | Arthur Drakeford | 59.1 | +6.7 | ||
Nationalist | Arthur Clerke | 40.9 | −6.7 | ||
Labor hold | Swing | +6.7 | |||
Party | Candidate | Votes | % | ±% | |
---|---|---|---|---|---|
Labor | Arthur Drakeford | 10,196 | 52.4 | ||
Nationalist | Robert Gilbertson | 9,254 | 47.6 | ||
Total formal votes | 19,450 | 99.3 | |||
Informal votes | 144 | 0.7 | |||
Turnout | 19,594 | 94.8 | |||
Labor hold | Swing | ||||
Party | Candidate | Votes | % | ±% | |
---|---|---|---|---|---|
Labor | Frank Keane | 12,375 | 55.0 | +10.9 | |
Nationalist | Thomas Ryan | 10,106 | 45.0 | −10.9 | |
Total formal votes | 22,481 | 99.6 | −0.1 | ||
Informal votes | 96 | 0.4 | +0.1 | ||
Turnout | 22,577 | 61.0 | +2.9 | ||
Labor gain from Nationalist | Swing | +10.9 | |||
Party | Candidate | Votes | % | ±% | |
---|---|---|---|---|---|
Nationalist | Thomas Ryan | 10,254 | 55.9 | −1.4 | |
Labor | Alexander Taylor | 8,093 | 44.1 | +1.4 | |
Total formal votes | 18,347 | 99.7 | +0.7 | ||
Informal votes | 58 | 0.3 | −0.7 | ||
Turnout | 18,405 | 58.1 | −7.2 | ||
Nationalist hold | Swing | -1.4 | |||
Party | Candidate | Votes | % | ±% | |
---|---|---|---|---|---|
Nationalist | Thomas Ryan | 11,607 | 57.3 | +2.2 | |
Labor | Joseph Murphy | 8,661 | 42.7 | −2.2 | |
Total formal votes | 20,268 | 99.0 | +1.7 | ||
Informal votes | 210 | 1.0 | −1.7 | ||
Turnout | 20,478 | 65.3 | +2.1 | ||
Nationalist hold | Swing | +2.2 | |||
Party | Candidate | Votes | % | ±% | |
---|---|---|---|---|---|
Nationalist | Thomas Ryan | 9,551 | 55.1 | +7.5 | |
Labor | Maurice Blackburn | 7,782 | 44.9 | −7.5 | |
Total formal votes | 17,333 | 97.3 | −1.3 | ||
Informal votes | 473 | 2.7 | +1.3 | ||
Turnout | 17,806 | 63.2 | +7.1 | ||
Nationalist gain from Labor | Swing | +7.5 | |||
Party | Candidate | Votes | % | ±% | |
---|---|---|---|---|---|
Labor | Maurice Blackburn | 7,342 | 52.4 | +11.3 | |
Liberal | Edward Reynolds | 6,660 | 47.6 | −11.3 | |
Total formal votes | 14,002 | 98.6 | −0.4 | ||
Informal votes | 195 | 1.4 | +0.4 | ||
Turnout | 14,197 | 56.1 | −10.1 | ||
Labor gain from Liberal | Swing | +11.3 | |||
Party | Candidate | Votes | % | ±% | |
---|---|---|---|---|---|
Liberal | William Watt | 7,134 | 58.9 | +13.5 | |
Labor | Frank Keane | 4,987 | 41.1 | +0.1 | |
Total formal votes | 12,121 | 99.0 | −0.6 | ||
Informal votes | 125 | 1.0 | +0.6 | ||
Turnout | 12,246 | 66.2 | +14.0 | ||
Liberal hold | Swing | N/A | |||
Brunswick East is an inner-city suburb in Melbourne, Victoria, Australia, 5 km (3.1 mi) north of Melbourne's Central Business District, located within the City of Merri-bek local government area. Brunswick East recorded a population of 13,279 at the 2021 census.
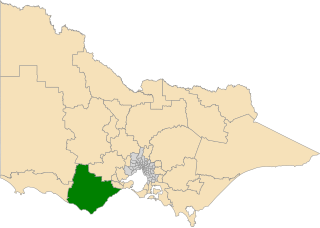
The electoral district of Polwarth is an electoral district of the Victorian Legislative Assembly. It is located in south-west rural Victoria, west of Geelong, and covers the Colac and Corangamite local government areas (LGA), parts of the Moyne, Golden Plains and Surf Coast LGAs, and slivers of the Ararat and Greater Geelong LGAs, running along the Great Ocean Road taking in Anglesea, Cape Otway, Peterborough, Aireys Inlet, Lorne, Wye River, Apollo Bay and Port Campbell, covering the inland towns of Winchelsea, Colac, Camperdown and Terang along the Princes Highway, and Inverleigh, Cressy, Lismore and Mortlake on the Hamilton Highway, and finally, includes the Otway Ranges and Lake Corangamite.
The electoral district of Essendon is an electoral district of the Victorian Legislative Assembly. It was first created in 1904 after the abolition of the larger Essendon and Flemington electorate, and covers some of the north-western suburbs of Melbourne, including Essendon, Moonee Ponds and Ascot Vale.
The electoral district of Evelyn is an electorate of the Victorian Legislative Assembly covering the urban fringe north east of Melbourne. It was first proclaimed in 1859.
Northern Metropolitan Region is one of the eight electoral regions of Victoria, Australia, which elects five members to the Victorian Legislative Council by proportional representation. The region was created in 2006 following the 2005 reform of the Victorian Legislative Council.
The electoral district of Niddrie is a metropolitan electorate approximately 8 kilometres (5 mi) northwest of Melbourne, Australia in Victoria's Legislative Assembly.
The electoral district of Lowan is a rural Victorian Legislative Assembly electoral district of the Victorian Parliament. It is located within the Western Victoria Region of the Legislative Council. It was initially created by the Electoral Act Amendment Act 1888, taking effect at the 1889 elections. It is the state’s biggest electorate by area, covering about 41,858 km².
The electoral district of Berwick is an electoral district of the Legislative Assembly in the Australian state of Victoria.
The electoral district of Glen Waverley is an electoral district of the Legislative Assembly in the Australian state of Victoria.
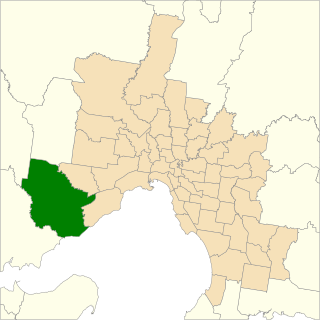
The electoral district of Werribee is an electoral district of the Legislative Assembly in the Australian state of Victoria. It has existed in two incarnations, first from 1976 to 2002, and was created again in the 2013 redistribution and came into effect at the 2014 state election.
This is a list of electoral results for the district of Mulgrave in Victorian state elections.
This is a list of electoral results for the Electoral district of Warrandyte in Victorian state elections.
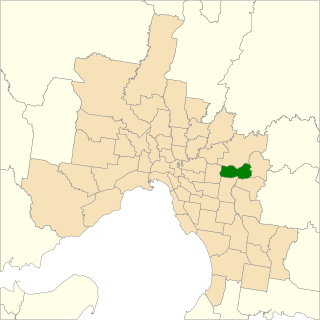
The electoral district of Ringwood is an electoral district of the Victorian Legislative Assembly, located in the east of Melbourne. It was first proclaimed in 1958 and was abolished in 1992. Some of Ringwood was included in the new electoral district of Bayswater that year. Kay Setches, who was at the time the last member for Ringwood, contested and lost Bayswater at the 1992 election.
The electoral district of Murray Plains is an electoral district of the Victorian Legislative Assembly in Australia. It was created in the redistribution of electoral boundaries in 2013, and came into effect at the 2014 state election.
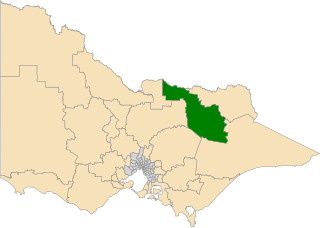
The electoral district of Ovens Valley is an electoral district of the Victorian Legislative Assembly in Australia. It was created in the redistribution of electoral boundaries in 2013, and came into effect at the 2014 state election.
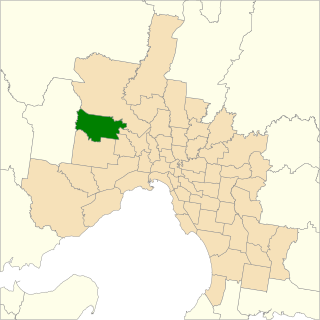
The electoral district of Sydenham is an electoral district of the Victorian Legislative Assembly in Australia. It was created in the redistribution of electoral boundaries in 2013, and came into effect at the 2014 state election.
The Electoral district of Laverton is an electoral district of the Victorian Legislative Assembly in Australia. It was created in the redistribution of electoral boundaries in 2021, and came into effect at the 2022 Victorian state election.
The electoral district of Greenvale is an electoral district of the Victorian Legislative Assembly in Australia. It was created in the redistribution of electoral boundaries in 2021, and came into effect at the 2022 Victorian state election.
The Electoral district of Kalkallo is an electoral district of the Victorian Legislative Assembly in Australia. It was created in the redistribution of electoral boundaries in 2021, and came into effect at the 2022 Victorian state election.
This is a list of electoral district results for the 2022 Victorian state election for the Legislative Assembly.