Related Research Articles

Cranbourne is an electoral district of the Victorian Legislative Assembly. It is located south-east of Melbourne and includes the suburbs of Botanic Ridge, Cranbourne, Cranbourne East, Cranbourne North, Cranbourne West, Junction Village, as well as parts of Clyde, Clyde North, Cranbourne South, Devon Meadows, Lynbrook and Lyndhurst. It was created prior to the 1992 state election.

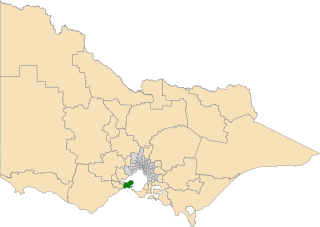
South Barwon is an electoral district of the Legislative Assembly in the Australian state of Victoria. Located in a mixed urban and rural area south of the Barwon River, it covers an area of 621 km², including the Geelong suburbs of Belmont and Grovedale, Waurn Ponds and part of Highton, the coastal centre of Torquay and the rural towns of Barrabool, Bellbrae, Connewarre, Gnarwarre, Modewarre, Moriac and Mount Moriac. The electorate had a population of 52,241 at the 2001 census.
The electoral district of Bellarine is one of the electoral districts of Victoria, Australia, for the Victorian Legislative Assembly. It covers an area of 367 square kilometres (142 sq mi) stretching from the Bellarine Peninsula to the outer eastern suburbs of Geelong. It includes the towns of Barwon Heads, Clifton Springs, Drysdale, Indented Head, Ocean Grove, Point Lonsdale, Portarlington and Queenscliff and the Geelong suburb of Leopold. It lies within the Western Victoria Region of the upper house, the Legislative Council.
Barwon, an electoral district of the Legislative Assembly in the Australian state of New South Wales, was established in 1894. It was abolished in 1904 and re-established in 1927.

This is a list of electoral results for the district of Brighton in Victorian state elections.
This is a list of electoral results for the Electoral district of Brunswick in Victorian state elections.
This is a list of electoral results for the Electoral district of Dandenong in Victorian state elections.
This is a list of electoral results for the Electoral district of Geelong in Victorian state elections.
This is a list of electoral results for the Electoral district of Hastings in Victorian state elections.
This is a list of electoral results for the Electoral district of Kororoit in Victorian state elections.
This is a list of electoral results for the district of Lara in Victorian state elections.
This is a list of electoral results for the Electoral district of Melbourne in Victorian state elections.
This is a list of electoral results for the district of Mulgrave in Victorian state elections.
This is a list of electoral results for the Electoral district of Narre Warren North in Victorian state elections.
This is a list of electoral results for the Electoral district of Nepean in Victorian state elections.
This is a list of electoral results for the Electoral district of Preston in Victorian state elections.
This is a list of electoral results for the Electoral district of Sandringham in Victorian state elections.
This is a list of electoral results for the Electoral district of Tarneit in Victorian state elections.
This is a list of electoral results for the Electoral district of Warrandyte in Victorian state elections.
This is a list of electoral results for the district of Yan Yean in Victorian state elections.
References
- "South Barwon District results". Victorian Electoral Commission. Archived from the original on 21 March 2012. Retrieved 21 November 2011.
- ↑ Green, Antony (11 January 2023). "VIC22 – 2-Party Preferred Results and Swings by District". Antony Green's Election Blog. Retrieved 28 January 2023.
- ↑ VIC 2021 Final Redistribution, ABC News. [Retrieved 1 January 2023.
- ↑ South Barwon District results, Victorian Electoral Commission. Retrieved 1 December 2022.
- ↑ State Election 2018: South Barwon District, VEC.
- ↑ State Election 2014: South Barwon District, VEC.