This is a list of electoral results for the Electoral district of Kew in Victorian state elections.
Order | Image | Member | Party | Term | Notes | |
---|---|---|---|---|---|---|
1 | Wilfrid Kent Hughes (1895–1970) | Nationalist | 9 April 1927 – 1931 | Served as minister under McPherson and Argyle. Served as Deputy Premier under Argyle and Hollway. Retired. Later held the federal seat of Chisholm and served as minister under Menzies. [1] | ||
United Australia | 1931–1945 | |||||
Liberal / LCP | 1945 – 31 October 1949 | |||||
2 | Arthur Rylah (1909–1974) | LCP / Liberal | 17 December 1949 – 5 March 1971 | Served as Deputy Premier under Bolte. Retired. [2] | ||
3 | Dick Hamer (1916–2004) | Liberal | 17 April 1971 – 17 July 1981 | Previously a member of the Victorian Legislative Council. Served as minister under Bolte. Served as Premier from 1972 to 1981. Retired. [3] | ||
4 | Prue Sibree (1946–) | Liberal | 15 August 1981 – 19 March 1988 | Retired. [4] | ||
5 | Jan Wade (1937–) | Liberal | 19 March 1988 – 17 September 1999 | Served as minister under Kennett. Retired. [5] | ||
6 | Andrew McIntosh (1955–) | Liberal | 18 September 1999 – 29 November 2014 | Served as minister under Baillieu and Napthine. Resigned. [6] | ||
7 | Tim Smith (1983–) | Liberal | 29 November 2014 – 26 November 2022 | Resigned. [7] | ||
8 | Jess Wilson (1990–) | Liberal | 26 November 2022 – present | Incumbent. |
Party | Candidate | Votes | % | ±% | |
---|---|---|---|---|---|
Liberal | Jess Wilson | 19,321 | 44.3 | −5.0 | |
Labor | Lucy Skelton | 9,896 | 22.7 | −8.8 | |
Independent | Sophie Torney | 9,200 | 21.1 | +21.1 | |
Greens | Jackie Carter | 3,612 | 8.3 | −6.9 | |
Family First | Ann Seeley | 751 | 1.7 | +1.7 | |
Animal Justice | Ruby Schofield | 507 | 1.2 | −0.9 | |
Independent | Finlay Davis | 158 | 0.4 | +0.4 | |
Independent | Kym Sullivan | 147 | 0.3 | +0.3 | |
Total formal votes | 43,592 | 97.0 | +1.1 | ||
Informal votes | 1,367 | 3.0 | −1.1 | ||
Turnout | 44,959 | 90.1 | −2.3 | ||
Two-party-preferred result | |||||
Liberal | Jess Wilson | 23,529 | 54.0 | −0.7 | |
Labor | Lucy Skelton | 20,063 | 46.0 | +0.7 | |
Liberal hold | Swing | –0.7 |
Party | Candidate | Votes | % | ±% | |
---|---|---|---|---|---|
Liberal | Tim Smith | 19,098 | 49.26 | −7.93 | |
Labor | Marg D'Arcy | 11,960 | 30.85 | +4.35 | |
Greens | Alex Marks | 5,961 | 15.38 | −0.94 | |
Animal Justice | Bronwyn Gardiner | 915 | 2.36 | +2.36 | |
Sustainable Australia | Paul Scaturchio | 835 | 2.15 | +2.15 | |
Total formal votes | 38,769 | 95.91 | +0.02 | ||
Informal votes | 1,655 | 4.09 | −0.02 | ||
Turnout | 40,424 | 91.33 | −2.35 | ||
Two-party-preferred result | |||||
Liberal | Tim Smith | 21,231 | 54.78 | −5.87 | |
Labor | Marg D'Arcy | 17,528 | 45.22 | +5.87 | |
Liberal hold | Swing | −5.87 | |||
Party | Candidate | Votes | % | ±% | |
---|---|---|---|---|---|
Liberal | Tim Smith | 22,552 | 57.2 | −3.4 | |
Labor | James Gaffey | 10,448 | 26.5 | +3.2 | |
Greens | Lynn Frankes | 6,433 | 16.3 | +1.9 | |
Total formal votes | 39,433 | 95.9 | −0.8 | ||
Informal votes | 1,691 | 4.1 | +0.8 | ||
Turnout | 41,124 | 93.7 | +1.1 | ||
Two-party-preferred result | |||||
Liberal | Tim Smith | 23,899 | 60.6 | −5.0 | |
Labor | James Gaffey | 15,510 | 39.4 | +5.0 | |
Liberal hold | Swing | −5.0 | |||
Party | Candidate | Votes | % | ±% | |
---|---|---|---|---|---|
Liberal | Andrew McIntosh | 19,878 | 60.09 | +6.35 | |
Labor | Kate Jackson | 7,750 | 23.43 | -3.96 | |
Greens | Emma Henley | 4,879 | 14.75 | -1.34 | |
Family First | Timothy Hunter | 576 | 1.74 | -0.21 | |
Total formal votes | 33,083 | 96.65 | -0.64 | ||
Informal votes | 1,145 | 3.35 | +0.64 | ||
Turnout | 34,228 | 92.75 | +1.12 | ||
Two-party-preferred result | |||||
Liberal | Andrew McIntosh | 21,560 | 65.19 | +5.63 | |
Labor | Kate Jackson | 11,512 | 34.81 | -5.63 | |
Liberal hold | Swing | +5.63 | |||
Party | Candidate | Votes | % | ±% | |
---|---|---|---|---|---|
Liberal | Andrew McIntosh | 17,269 | 53.7 | +4.2 | |
Labor | Maree Williams | 8,801 | 27.4 | -3.7 | |
Greens | Emma Henley | 5,170 | 16.1 | -1.3 | |
Family First | Wallis Pattinsonn | 628 | 2.0 | +2.0 | |
Independent | John Dobinson | 267 | 0.8 | +0.8 | |
Total formal votes | 32,135 | 97.3 | +0.1 | ||
Informal votes | 896 | 2.7 | -0.1 | ||
Turnout | 33,031 | 91.6 | |||
Two-party-preferred result | |||||
Liberal | Andrew McIntosh | 19,131 | 59.6 | +3.6 | |
Labor | Maree Williams | 12,990 | 40.4 | -3.6 | |
Liberal hold | Swing | +3.6 | |||
Party | Candidate | Votes | % | ±% | |
---|---|---|---|---|---|
Liberal | Andrew McIntosh | 15,807 | 49.5 | -12.2 | |
Labor | Maree Williams | 9,926 | 31.1 | -2.8 | |
Greens | Cheryl Clark | 5,543 | 17.4 | +17.4 | |
Democrats | Mary Dettman | 638 | 2.0 | +2.0 | |
Total formal votes | 31,914 | 97.2 | -0.4 | ||
Informal votes | 930 | 2.8 | +0.4 | ||
Turnout | 32,844 | 92.6 | |||
Two-party-preferred result | |||||
Liberal | Andrew McIntosh | 17,865 | 56.0 | -7.8 | |
Labor | Maree Williams | 14,049 | 44.0 | +7.8 | |
Liberal hold | Swing | -7.8 | |||
Party | Candidate | Votes | % | ±% | |
---|---|---|---|---|---|
Liberal | Andrew McIntosh | 19,594 | 61.8 | -1.9 | |
Labor | Jonathan Lewes | 10,751 | 33.9 | +1.1 | |
Hope | Peter Hale | 1,380 | 4.3 | +4.3 | |
Total formal votes | 31,725 | 97.6 | -0.6 | ||
Informal votes | 795 | 2.4 | +0.6 | ||
Turnout | 32,520 | 91.2 | |||
Two-party-preferred result | |||||
Liberal | Andrew McIntosh | 20,247 | 63.8 | -1.2 | |
Labor | Jonathan Lewes | 11,478 | 36.2 | +1.2 | |
Liberal hold | Swing | -1.2 | |||
Party | Candidate | Votes | % | ±% | |
---|---|---|---|---|---|
Liberal | Jan Wade | 19,946 | 63.7 | -4.2 | |
Labor | Bill Elms | 10,275 | 32.8 | +9.2 | |
Natural Law | Gabrielle Dewan | 1,101 | 3.5 | +3.5 | |
Total formal votes | 31,322 | 98.2 | +1.2 | ||
Informal votes | 587 | 1.8 | -1.2 | ||
Turnout | 31,909 | 93.2 | |||
Two-party-preferred result | |||||
Liberal | Jan Wade | 20,339 | 65.0 | -6.5 | |
Labor | Bill Elms | 10,949 | 35.0 | +6.5 | |
Liberal hold | Swing | -6.5 | |||
Party | Candidate | Votes | % | ±% | |
---|---|---|---|---|---|
Liberal | Jan Wade | 20,484 | 67.9 | +5.6 | |
Labor | Wayne Clarke | 7,115 | 23.6 | -14.2 | |
Independent | Jonathan Shepherd | 2,570 | 8.5 | +8.5 | |
Total formal votes | 30,169 | 97.0 | +0.3 | ||
Informal votes | 946 | 3.0 | -0.3 | ||
Turnout | 31,115 | 94.1 | |||
Two-party-preferred result | |||||
Liberal | Jan Wade | 21,553 | 71.5 | +9.3 | |
Labor | Wayne Clarke | 8,578 | 28.5 | -9.3 | |
Liberal hold | Swing | +9.3 | |||
Party | Candidate | Votes | % | ±% | |
---|---|---|---|---|---|
Liberal | Jan Wade | 15,715 | 61.00 | +0.80 | |
Labor | Tim Muffet | 10,048 | 39.00 | -0.80 | |
Total formal votes | 25,763 | 96.51 | -0.58 | ||
Informal votes | 932 | 3.49 | +0.58 | ||
Turnout | 26,695 | 90.37 | -1.54 | ||
Liberal hold | Swing | +0.80 | |||
Party | Candidate | Votes | % | ±% | |
---|---|---|---|---|---|
Liberal | Jan Wade | 12,824 | 54.56 | -5.64 | |
Labor | Tim Muffet | 4,897 | 20.84 | -18.96 | |
Democrats | Sonia O'Brien | 4,607 | 19.60 | +19.60 | |
Democratic Labor | Mark Beshara | 798 | 3.40 | +3.40 | |
Independent | Bill Thiele | 377 | 1.60 | +1.60 | |
Total formal votes | 23,503 | 97.16 | |||
Informal votes | 686 | 2.84 | |||
Turnout | 24,189 | 81.40 | |||
Two-party-preferred result | |||||
Liberal | Jan Wade | 65.4 | +5.2 | ||
Labor | Tim Muffet | 34.6 | -5.2 | ||
Liberal hold | Swing | +5.2 | |||
Party | Candidate | Votes | % | ±% | |
---|---|---|---|---|---|
Liberal | Prue Sibree | 16,403 | 60.2 | +4.4 | |
Labor | Annamaria Dierer | 10,843 | 39.8 | +5.8 | |
Total formal votes | 27,246 | 97.1 | |||
Informal votes | 818 | 2.9 | |||
Turnout | 28,064 | 91.9 | |||
Liberal hold | Swing | -0.3 | |||
Party | Candidate | Votes | % | ±% | |
---|---|---|---|---|---|
Liberal | Prue Sibree | 14,123 | 55.8 | +1.4 | |
Labor | George Theodoridis | 8,615 | 34.0 | +2.7 | |
Democrats | Veronica Lysaght | 2,569 | 10.2 | +2.9 | |
Total formal votes | 25,307 | 98.1 | +0.4 | ||
Informal votes | 499 | 1.9 | -0.4 | ||
Turnout | 25,806 | 92.7 | +1.5 | ||
Two-party-preferred result | |||||
Liberal | Prue Sibree | 15,215 | 60.1 | -1.1 | |
Labor | George Theodoridis | 10,092 | 39.9 | +1.1 | |
Liberal hold | Swing | -1.1 | |||
Party | Candidate | Votes | % | ±% | |
---|---|---|---|---|---|
Liberal | Prue Sibree | 9,877 | 49.5 | -4.9 | |
Labor | Iain Messer | 5,998 | 30.1 | -1.2 | |
Democrats | Veronica Lysaght | 2,327 | 11.7 | +4.4 | |
Democratic Labor | Daniel Condon | 1,277 | 6.4 | -0.7 | |
Independent | Peter Allan | 323 | 1.6 | +1.6 | |
Independent | Kevin Tehan | 154 | 0.8 | +0.8 | |
Total formal votes | 19,956 | 97.4 | -0.3 | ||
Informal votes | 533 | 2.6 | +0.3 | ||
Turnout | 20,489 | 71.2 | -20.0 | ||
After distribution of preferences | |||||
Liberal | Prue Sibree | 10,211 | 51.2 | N/A | |
Labor | Iain Messer | 6,145 | 30.8 | N/A | |
Democrats | Veronica Lysaght | 3,600 | 18.0 | N/A | |
Liberal hold | Swing | N/A | |||
Party | Candidate | Votes | % | ±% | |
---|---|---|---|---|---|
Liberal | Rupert Hamer | 14,096 | 54.4 | -3.3 | |
Labor | Wesley Blackmore | 8,102 | 31.3 | +5.1 | |
Democrats | Keith Bruckner | 1,894 | 7.3 | +7.3 | |
Democratic Labor | Standish Keon | 1,827 | 7.1 | +2.9 | |
Total formal votes | 25,919 | 97.7 | -0.4 | ||
Informal votes | 597 | 2.3 | +0.4 | ||
Turnout | 26,516 | 91.2 | -0.4 | ||
Two-party-preferred result | |||||
Liberal | Rupert Hamer | 15,875 | 61.2 | -8.8 | |
Labor | Wesley Blackmore | 10,044 | 38.8 | +8.8 | |
Liberal hold | Swing | -8.8 | |||
Party | Candidate | Votes | % | ±% | |
---|---|---|---|---|---|
Liberal | Rupert Hamer | 15,379 | 57.7 | -6.0 | |
Labor | Gary Jungwirth | 6,997 | 26.2 | -1.7 | |
Independent | Charles Barrington | 1,713 | 6.4 | +6.4 | |
Independent | Margaret Tighe | 1,455 | 5.5 | +5.5 | |
Democratic Labor | Francis Duffy | 1,121 | 4.2 | -4.1 | |
Total formal votes | 26,665 | 98.1 | |||
Informal votes | 516 | 1.9 | |||
Turnout | 27,181 | 91.6 | |||
Two-party-preferred result | |||||
Liberal | Rupert Hamer | 18,670 | 70.0 | -1.1 | |
Labor | Gary Jungwirth | 7,995 | 30.0 | +1.1 | |
Liberal hold | Swing | -1.1 | |||
Party | Candidate | Votes | % | ±% | |
---|---|---|---|---|---|
Liberal | Rupert Hamer | 16,018 | 64.7 | +23.0 | |
Labor | James Hilson | 6,603 | 26.7 | +0.9 | |
Democratic Labor | Francis Duffy | 2,148 | 8.7 | -5.1 | |
Total formal votes | 24,769 | 98.0 | +1.2 | ||
Informal votes | 494 | 2.0 | -1.2 | ||
Turnout | 25,263 | 90.3 | -2.7 | ||
Two-party-preferred result | |||||
Liberal | Rupert Hamer | 17,844 | 72.0 | +12.6 | |
Labor | James Hilson | 6,925 | 28.0 | -12.6 | |
Liberal hold | Swing | +12.6 | |||
Party | Candidate | Votes | % | ±% | |
---|---|---|---|---|---|
Liberal | Rupert Hamer | 13,422 | 64.8 | +23.1 | |
Labor | Rosslyn Ives | 6,325 | 30.5 | +4.7 | |
Independent | L R Hull | 968 | 4.7 | +4.7 | |
Total formal votes | 20,715 | 97.7 | +0.5 | ||
Informal votes | 497 | 2.3 | -0.5 | ||
Turnout | 21,212 | 82.8 | -10.2 | ||
Liberal hold | Swing | N/A |
Party | Candidate | Votes | % | ±% | |
---|---|---|---|---|---|
Liberal | Arthur Rylah | 9,692 | 41.7 | -12.9 | |
Labor | Rosslyn Ives | 5,987 | 25.8 | -1.1 | |
Democratic Labor | Francis Duffy | 3,212 | 13.8 | -4.7 | |
Independent | Bertram Wainer | 2,624 | 11.3 | +11.3 | |
Independent | Dorothy Buchanan | 1,727 | 7.4 | +7.4 | |
Total formal votes | 23,242 | 96.8 | -0.4 | ||
Informal votes | 756 | 3.2 | +0.4 | ||
Turnout | 23,998 | 93.0 | -0.4 | ||
Two-party-preferred result | |||||
Liberal | Arthur Rylah | 13,808 | 59.4 | -10.9 | |
Labor | Rosslyn Ives | 9,434 | 40.6 | +10.9 | |
Liberal hold | Swing | -10.9 | |||
Party | Candidate | Votes | % | ±% | |
---|---|---|---|---|---|
Liberal | Arthur Rylah | 12,712 | 54.6 | -3.3 | |
Labor | Eric Sibly | 6,261 | 26.9 | +0.6 | |
Democratic Labor | Francis Duffy | 4,305 | 18.5 | +2.7 | |
Total formal votes | 23,278 | 97.2 | |||
Informal votes | 664 | 2.8 | |||
Turnout | 23,942 | 93.4 | |||
Two-party-preferred result | |||||
Liberal | Arthur Rylah | 16,372 | 70.3 | -1.1 | |
Labor | Eric Sibly | 6,906 | 29.7 | +1.1 | |
Liberal hold | Swing | -1.1 | |||
Party | Candidate | Votes | % | ±% | |
---|---|---|---|---|---|
Liberal and Country | Arthur Rylah | 11,319 | 59.3 | -0.2 | |
Labor | William Cooper | 4,785 | 25.1 | +2.3 | |
Democratic Labor | Francis Duffy | 2,991 | 15.7 | -0.2 | |
Total formal votes | 19,095 | 98.1 | +0.5 | ||
Informal votes | 378 | 1.9 | -0.5 | ||
Turnout | 19,473 | 91.0 | -0.9 | ||
Two-party-preferred result | |||||
Liberal and Country | Arthur Rylah | 13,861 | 72.6 | -0.6 | |
Labor | William Cooper | 5,234 | 27.4 | +0.6 | |
Liberal and Country hold | Swing | -0.6 | |||
Party | Candidate | Votes | % | ±% | |
---|---|---|---|---|---|
Liberal and Country | Arthur Rylah | 11,452 | 59.5 | -3.1 | |
Labor | William Cooper | 4,384 | 22.8 | +3.3 | |
Democratic Labor | Francis Duffy | 3,068 | 15.9 | +0.2 | |
Communist | Eric Thornton | 357 | 1.8 | -0.4 | |
Total formal votes | 19,261 | 97.6 | -0.5 | ||
Informal votes | 466 | 2.4 | +0.5 | ||
Turnout | 19,727 | 91.9 | -0.2 | ||
Two-party-preferred result | |||||
Liberal and Country | Arthur Rylah | 14,096 | 73.2 | -3.0 | |
Labor | William Cooper | 5,165 | 26.8 | +3.0 | |
Liberal and Country hold | Swing | -3.0 | |||
Party | Candidate | Votes | % | ±% | |
---|---|---|---|---|---|
Liberal and Country | Arthur Rylah | 12,375 | 62.6 | ||
Labor | Kevin Lynch | 3,845 | 19.5 | ||
Democratic Labor | John Buchanan | 3,108 | 15.7 | ||
Communist | Ralph Gibson | 425 | 2.2 | ||
Total formal votes | 19,753 | 98.1 | |||
Informal votes | 372 | 1.9 | |||
Turnout | 20,125 | 92.1 | |||
Two-party-preferred result | |||||
Liberal and Country | Arthur Rylah | 15,058 | 76.2 | ||
Labor | Kevin Lynch | 4,695 | 23.8 | ||
Liberal and Country hold | Swing | ||||
Party | Candidate | Votes | % | ±% | |
---|---|---|---|---|---|
Liberal and Country | Arthur Rylah | 14,152 | 71.6 | ||
Labor | Norman Williams | 4,883 | 24.7 | ||
Communist | Ralph Gibson | 731 | 3.7 | ||
Total formal votes | 19,766 | 98.0 | |||
Informal votes | 401 | 2.0 | |||
Turnout | 20,167 | 91.4 | |||
Two-party-preferred result | |||||
Liberal and Country | Arthur Rylah | 14,225 | 72.0 | ||
Labor | Norman Williams | 5,541 | 28.0 | ||
Liberal and Country hold | Swing | ||||
Party | Candidate | Votes | % | ±% | |
---|---|---|---|---|---|
Liberal and Country | Arthur Rylah | 7,780 | 37.4 | -62.6 | |
Labor | Norman Williams | 6,696 | 32.2 | +32.2 | |
Electoral Reform | John Eddy | 6,303 | 30.3 | +30.3 | |
Total formal votes | 20,779 | 98.0 | |||
Informal votes | 418 | 2.0 | |||
Turnout | 21,197 | 93.3 | |||
Two-party-preferred result | |||||
Liberal and Country | Arthur Rylah | 13,076 | 62.9 | -37.1 | |
Labor | Norman Williams | 7,703 | 37.1 | +37.1 | |
Liberal and Country hold | Swing | N/A | |||
Party | Candidate | Votes | % | ±% | |
---|---|---|---|---|---|
Liberal and Country | Arthur Rylah | unopposed | |||
Liberal and Country hold | Swing | ||||
Party | Candidate | Votes | % | ±% | |
---|---|---|---|---|---|
Liberal and Country | Arthur Rylah | 14,480 | 74.8 | +3.7 | |
Independent | Thomas Fynmore | 4,888 | 25.2 | +25.2 | |
Total formal votes | 19,368 | 95.5 | -3.6 | ||
Informal votes | 912 | 4.5 | +3.6 | ||
Turnout | 20,280 | 83.6 | -6.4 | ||
Liberal and Country hold | Swing | N/A | |||
Party | Candidate | Votes | % | ±% | |
---|---|---|---|---|---|
Liberal | Wilfrid Kent Hughes | 16,528 | 71.2 | -28.8 | |
Labor | Rupert Purchase | 6,694 | 28.8 | +28.8 | |
Total formal votes | 23,222 | 99.1 | |||
Informal votes | 204 | 0.9 | |||
Turnout | 23,426 | 90.0 | |||
Liberal hold | Swing | N/A | |||
Party | Candidate | Votes | % | ±% | |
---|---|---|---|---|---|
Liberal | Wilfrid Kent Hughes | unopposed | |||
Liberal hold | Swing | ||||
Party | Candidate | Votes | % | ±% | |
---|---|---|---|---|---|
United Australia | Wilfrid Kent Hughes | unopposed | |||
United Australia hold | Swing | ||||
Party | Candidate | Votes | % | ±% | |
---|---|---|---|---|---|
United Australia | Wilfrid Hughes | 18,496 | 68.0 | -0.1 | |
Labor | Arthur Kyle | 8,716 | 32.0 | +0.1 | |
Total formal votes | 27,212 | 98.8 | 0.0 | ||
Informal votes | 321 | 1.2 | 0.0 | ||
Turnout | 27,533 | 92.8 | +0.8 | ||
United Australia hold | Swing | -0.1 | |||
Party | Candidate | Votes | % | ±% | |
---|---|---|---|---|---|
United Australia | Wilfrid Hughes | 17,053 | 68.1 | +2.2 | |
Labor | Arthur Kyle | 8,002 | 31.9 | -2.2 | |
Total formal votes | 25,055 | 98.8 | +0.1 | ||
Informal votes | 315 | 1.2 | -0.1 | ||
Turnout | 25,370 | 92.0 | -1.5 | ||
United Australia hold | Swing | +2.2 | |||
Party | Candidate | Votes | % | ±% | |
---|---|---|---|---|---|
United Australia | Wilfrid Hughes | 15,641 | 65.9 | -11.4 | |
Labor | Thomas Botsman | 8,090 | 34.1 | +11.4 | |
Total formal votes | 23,731 | 98.7 | -0.2 | ||
Informal votes | 305 | 1.3 | +0.2 | ||
Turnout | 24,036 | 93.5 | +1.4 | ||
United Australia hold | Swing | -11.4 | |||
Party | Candidate | Votes | % | ±% | |
---|---|---|---|---|---|
United Australia | Kent Hughes | 17,566 | 77.3 | +15.3 | |
Labor | Thomas Mottram | 5,148 | 22.7 | -8.8 | |
Total formal votes | 22,714 | 98.9 | +0.3 | ||
Informal votes | 263 | 1.1 | -0.3 | ||
Turnout | 22,977 | 92.1 | -1.2 | ||
United Australia hold | Swing | +11.6 | |||
Party | Candidate | Votes | % | ±% | |
---|---|---|---|---|---|
Nationalist | Kent Hughes | 13,551 | 62.0 | +29.7 | |
Labor | Cyril Murphy | 6,889 | 31.5 | +6.7 | |
Independent | Constantine Crowley | 1,399 | 6.4 | +6.4 | |
Total formal votes | 21,839 | 98.6 | +1.0 | ||
Informal votes | 304 | 1.4 | -1.0 | ||
Turnout | 22,143 | 93.3 | +0.2 | ||
Two-party-preferred result | |||||
Nationalist | Kent Hughes | 65.7 | +21.5 | ||
Labor | Cyril Murphy | 34.3 | +34.3 | ||
Nationalist gain from Ind. Nationalist | Swing | N/A |
Party | Candidate | Votes | % | ±% | |
---|---|---|---|---|---|
Nationalist | Edward Reynolds | 6,346 | 32.3 | ||
Labor | Frederick Riley | 4,877 | 24.8 | ||
Independent | Wilfred Hughes | 4,727 | 24.1 | ||
Australian Liberal | William Clark | 3,696 | 18.8 | ||
Total formal votes | 19,646 | 97.6 | |||
Informal votes | 475 | 2.4 | |||
Turnout | 20,121 | 93.1 | |||
Two-candidate-preferred result | |||||
Independent | Wilfred Hughes | 10,964 | 55.8 | ||
Nationalist | Edward Reynolds | 8,682 | 44.2 | ||
Independent gain from Nationalist | Swing |
The electoral district of Malvern is an electorate of the Victorian Legislative Assembly. It contains the suburbs of Malvern, Armadale, Kooyong, Malvern East, Toorak, and parts of Glen Iris.
Cranbourne is an electoral district of the Victorian Legislative Assembly. It is located south-east of Melbourne and includes the suburbs of Botanic Ridge, Cranbourne, Cranbourne East, Cranbourne North, Cranbourne West, Junction Village, as well as parts of Clyde, Clyde North, Cranbourne South, Devon Meadows, Lynbrook and Lyndhurst. It was created prior to the 1992 state election.
Richmond is an electoral district of the Legislative Assembly in the Australian state of Victoria. It is currently a 13 km² electorate in the inner east of Melbourne, encompassing the suburbs of Richmond, Cremorne, Burnley, Abbotsford, Collingwood, Clifton Hill, North Fitzroy and Fitzroy. Historically a very safe seat for the Labor Party, Richmond has in recent elections become increasingly marginal against the Greens, who narrowly failed to win it at the 2014 Victorian state election.
The electoral district of Bayswater is one of the electoral districts of Victoria, Australia, for the Victorian Legislative Assembly. It covers an area of 39 square kilometres (15 sq mi) in outer eastern Melbourne, and includes the suburbs of Bayswater, Heathmont, Kilsyth South and The Basin, and parts of Bayswater North, Boronia, Ringwood and Wantirna. It lies within the Eastern Metropolitan Region of the upper house, the Legislative Council.
The electoral district of Kew is an electoral district of the Victorian Legislative Assembly. Located in eastern Melbourne, a few kilometres from the city centre, it is centred on the suburbs of Kew and Kew East. It also contains Balwyn, Balwyn North, Deepdene, and parts of Canterbury, Mont Albert, and Surrey Hills.
The electoral district of Hawthorn is an electoral district of the Victorian Legislative Assembly. It was first proclaimed in 1888 taking effect at the 1889 elections.
The electoral district of Thomastown is an electorate of the Victorian Legislative Assembly. It currently includes the suburbs of Lalor and Thomastown, and parts of Fawkner, Reservoir and Wollert, and has been in existence since 1985.
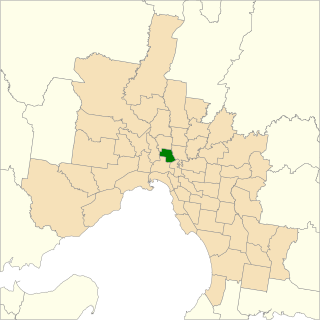
The electoral district of Brunswick is an electorate of the Victorian Legislative Assembly. It covers an area of 14 square kilometres (5.4 sq mi) in inner northern Melbourne, and includes the suburbs of Brunswick, Brunswick East, Carlton North, Fitzroy North, Princes Hill and parts of Brunswick West. It lies within the Northern Metropolitan Region of the upper house, the Legislative Council.
The electoral district of Caulfield is an electoral district of the Victorian Legislative Assembly. The electorate is surrounded by the other electoral districts of Prahran, Albert Park, Malvern, Oakleigh, Bentleigh and Brighton.
Prahran is an electoral district of the Legislative Assembly in the Australian state of Victoria. It was created by the Electoral Act Amendment Act 1888, taking effect at the 1889 elections. The electorate is the state’s smallest by area, covering a little under 11 km² in the inner south-east of Melbourne. It includes the suburbs of South Yarra, Prahran and Windsor, as well as parts of Balaclava, St Kilda, St Kilda East and Toorak.
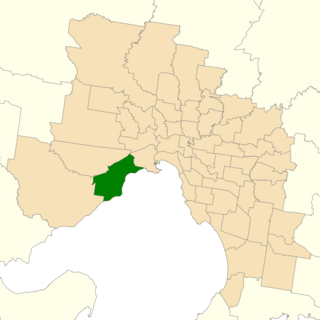
Williamstown is an electoral district of the Legislative Assembly in the Australian state of Victoria. It is a 33 km2 urban electorate in the inner south-western suburbs of Melbourne, encompassing the suburbs of Brooklyn, Newport, Spotswood, Williamstown and Yarraville. The electorate had a population of 54,426 as of the 2006 census.
The electoral district of Melbourne is an electorate of the Victorian Legislative Assembly. It currently includes the localities of Docklands, Carlton, Melbourne, East Melbourne, West Melbourne, North Melbourne, Parkville, Newmarket, Kensington and Flemington, and includes Melbourne University. The district has been in existence since 1856.
The electoral district of Broadmeadows is an electorate of the Victorian Legislative Assembly. It covers an area of 47 square kilometres (18 sq mi) in outer northern Melbourne, and includes the suburbs of Broadmeadows, Campbellfield, Coolaroo, Dallas, Fawkner, Jacana and Meadow Heights. It also includes parts of Glenroy, Roxburgh Park, Somerton and Westmeadows. It lies within the Northern Metropolitan Region of the upper house, the Legislative Council.
The electoral district of Bulleen is an electoral district of the Victorian Legislative Assembly. It covers an area of 39 square kilometres (15 sq mi) in eastern Melbourne, including the suburbs of Bulleen, Doncaster, Templestowe Lower, and part of Templestowe. It lies within the Eastern Metropolitan Region of the upper house, the Legislative Council.
The electoral district of Gippsland South is a Lower House electoral district of the Victorian Parliament. It is located within the Eastern Victoria Region of the Legislative Council.
The electoral district of Lowan is a rural Victorian Legislative Assembly electoral district of the Victorian Parliament. It is located within the Western Victoria Region of the Legislative Council. It was initially created by the Electoral Act Amendment Act 1888, taking effect at the 1889 elections. It is the state’s biggest electorate by area, covering about 41,858 km².
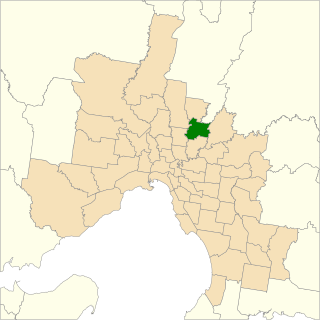
Bundoora is an electoral district of the Victorian Legislative Assembly. It covers an area of 35 square kilometres (14 sq mi) in north-eastern Melbourne, encompassing the suburbs of Bundoora, Kingsbury, Watsonia and Watsonia North, and parts of Greensborough, Macleod, Mill Park and Yallambie. It also includes the central campus of La Trobe University. It lies within the Northern Metropolitan Region of the upper house, the Legislative Council.
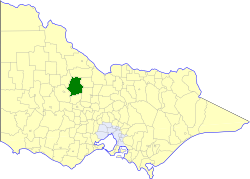
Ovens was an electoral district of the Legislative Assembly in the Australian state of Victoria from 1856 to 1927. It was based in northern Victoria, bordered by the Ovens River in the south-west and included the town of Beechworth, Victoria.
This is a list of electoral results for the electoral district of Ovens in Victorian state elections.