This article needs additional citations for verification .(April 2019) |
  | |
| Continent | Africa |
|---|---|
| Region | Central Africa |
| Coordinates | 1°00′N11°45′E / 1.000°N 11.750°E |
| Area | Ranked 77th |
| • Total | 267,667 km2 (103,347 sq mi) |
| • Land | 96.3% |
| • Water | 3.7% |
| Coastline | 885 km (550 mi) |
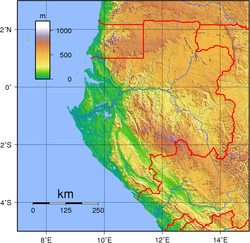
| Highest point | Mont Bengoué, 1070 m (not Mont Iboundji as claimed by some authorities) |
| Lowest point | Atlantic Ocean, 0 m |
| Longest river | Ogooué River |
| Climate | Tropical monsoon ('Am'), Tropical savanna ('Aw'); always hot, humid |
| Terrain | narrow coastal plain; hilly interior; savanna in east and south |
| Natural resources | Petroleum, natural gas, diamond, niobium, manganese, uranium, gold, timber, iron ore, hydropower |
| Environmental issues | deforestation, poaching |


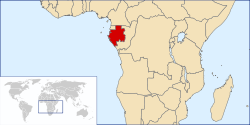
Gabon is a country in Central Africa, lying along the Atlantic Ocean, just south of the Bight of Biafra.