Related Research Articles
Psychometrics is a field of study within psychology concerned with the theory and technique of measurement. Psychometrics generally covers specialized fields within psychology and education devoted to testing, measurement, assessment, and related activities. Psychometrics is concerned with the objective measurement of latent constructs that cannot be directly observed. Examples of latent constructs include intelligence, introversion, mental disorders, and educational achievement. The levels of individuals on nonobservable latent variables are inferred through mathematical modeling based on what is observed from individuals' responses to items on tests and scales.

A chart is a graphical representation for data visualization, in which "the data is represented by symbols, such as bars in a bar chart, lines in a line chart, or slices in a pie chart". A chart can represent tabular numeric data, functions or some kinds of quality structure and provides different info.
Psychophysics quantitatively investigates the relationship between physical stimuli and the sensations and perceptions they produce. Psychophysics has been described as "the scientific study of the relation between stimulus and sensation" or, more completely, as "the analysis of perceptual processes by studying the effect on a subject's experience or behaviour of systematically varying the properties of a stimulus along one or more physical dimensions".

A pie chart is a circular statistical graphic which is divided into slices to illustrate numerical proportion. In a pie chart, the arc length of each slice is proportional to the quantity it represents. While it is named for its resemblance to a pie which has been sliced, there are variations on the way it can be presented. The earliest known pie chart is generally credited to William Playfair's Statistical Breviary of 1801.

Infographics are graphic visual representations of information, data, or knowledge intended to present information quickly and clearly. They can improve cognition by using graphics to enhance the human visual system's ability to see patterns and trends. Similar pursuits are information visualization, data visualization, statistical graphics, information design, or information architecture. Infographics have evolved in recent years to be for mass communication, and thus are designed with fewer assumptions about the readers' knowledge base than other types of visualizations. Isotypes are an early example of infographics conveying information quickly and easily to the masses.
William Playfair was a Scottish engineer and political economist. The founder of graphical methods of statistics, Playfair invented several types of diagrams: in 1786 he introduced the line, area and bar chart of economic data, and in 1801 he published what were likely the first pie chart and circle graph, used to show part-whole relations. Playfair has been reported to have been a secret agent for the British Government, although this is a subject of controversy.
Mathematical psychology is an approach to psychological research that is based on mathematical modeling of perceptual, thought, cognitive and motor processes, and on the establishment of law-like rules that relate quantifiable stimulus characteristics with quantifiable behavior. The mathematical approach is used with the goal of deriving hypotheses that are more exact and thus yield stricter empirical validations. There are five major research areas in mathematical psychology: learning and memory, perception and psychophysics, choice and decision-making, language and thinking, and measurement and scaling.
Quantitative psychology is a field of scientific study that focuses on the mathematical modeling, research design and methodology, and statistical analysis of psychological processes. It includes tests and other devices for measuring cognitive abilities. Quantitative psychologists develop and analyze a wide variety of research methods, including those of psychometrics, a field concerned with the theory and technique of psychological measurement.

Data and information visualization is the practice of designing and creating easy-to-communicate and easy-to-understand graphic or visual representations of a large amount of complex quantitative and qualitative data and information with the help of static, dynamic or interactive visual items. Typically based on data and information collected from a certain domain of expertise, these visualizations are intended for a broader audience to help them visually explore and discover, quickly understand, interpret and gain important insights into otherwise difficult-to-identify structures, relationships, correlations, local and global patterns, trends, variations, constancy, clusters, outliers and unusual groupings within data. When intended for the general public to convey a concise version of known, specific information in a clear and engaging manner, it is typically called information graphics.
Spatial visualization ability or visual-spatial ability is the ability to mentally manipulate 2-dimensional and 3-dimensional figures. It is typically measured with simple cognitive tests and is predictive of user performance with some kinds of user interfaces.
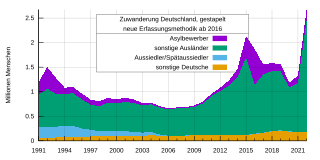
An area chart or area graph displays graphically quantitative data. It is based on the line chart. The area between axis and line are commonly emphasized with colors, textures and hatchings. Commonly one compares two or more quantities with an area chart.
Statistical graphics, also known as statistical graphical techniques, are graphics used in the field of statistics for data visualization.
Michael Louis Friendly is an American-Canadian psychologist, Professor of Psychology at York University in Ontario, Canada, and director of its Statistical Consulting Service, especially known for his contributions to graphical methods for categorical and multivariate data, and on the history of data and information visualisation.
Psychometric software refers to specialized programs used for the psychometric analysis of data obtained from tests, questionnaires, polls or inventories that measure latent psychoeducational variables. Although some psychometric analyses can be performed using general statistical software such as SPSS, most require specialized tools designed specifically for psychometric purposes.
Some of the research that is conducted in the field of psychology is more "fundamental" than the research conducted in the applied psychological disciplines, and does not necessarily have a direct application. The subdisciplines within psychology that can be thought to reflect a basic-science orientation include biological psychology, cognitive psychology, neuropsychology, and so on. Research in these subdisciplines is characterized by methodological rigor. The concern of psychology as a basic science is in understanding the laws and processes that underlie behavior, cognition, and emotion. Psychology as a basic science provides a foundation for applied psychology. Applied psychology, by contrast, involves the application of psychological principles and theories yielded up by the basic psychological sciences; these applications are aimed at overcoming problems or promoting well-being in areas such as mental and physical health and education.

Howard Charles Wainer is an American statistician, past principal research scientist at the Educational Testing Service, adjunct professor of statistics at the Wharton School of the University of Pennsylvania, and author, known for his contributions in the fields of statistics, psychometrics, and statistical graphics.

Chingis A. Izmailov was a Russian psychophysiologist and psychophysicist, the principal author of the spherical model of color space.

In statistics, a misleading graph, also known as a distorted graph, is a graph that misrepresents data, constituting a misuse of statistics and with the result that an incorrect conclusion may be derived from it.

Howard Gray Funkhouser was an American mathematician, historian and associate professor of mathematics at the Washington and Lee University, and later at the Phillips Exeter Academy, particularly known for his early work on the history of graphical methods.

Graphical perception is the human capacity for visually interpreting information on graphs and charts. Both quantitative and qualitative information can be said to be encoded into the image, and the human capacity to interpret it is sometimes called decoding. The importance of human graphical perception, what we discern easily versus what our brains have more difficulty decoding, is fundamental to good statistical graphics design, where clarity, transparency, accuracy and precision in data display and interpretation are essential for understanding the translation of data in a graph to clarify and interpret the science.
References
- ↑ Boot, W. R., Kramer, A. F., Simons, D. J., Fabiani, M., & Gratton, G. (2008). "The effects of video game playing on attention, memory, and executive control." Acta psychologica, 129(3), 387-398.
- ↑ Wilkinson, L., Wills, D., Rope, D., Norton, A., & Dubbs, R. (2006). The grammar of graphics. Springer.
- ↑ Spence, Ian, and Howard Wainer. "Who was Playfair Archived 3 March 2016 at the Wayback Machine ." Chance 10.1 (1997): 35-37.
- ↑ Spence, Ian, and Howard Wainer. "William Playfair: A daring worthless fellow Archived 3 November 2014 at the Wayback Machine ." Chance 10.1 (1997): 31-34.
- ↑ Spence, Ian, and Howard Wainer. "William Playfair." Statisticians of the Centuries. Springer New York, 2001. 105-110.
- ↑ Spence, Ian. "William Playfair and the psychology of graphs [ permanent dead link ]." 2006 JSM proceedings, American Statistical Association, Alexandria (2006): 2426-2436.
- ↑ Crampton, Jeremy W. The political mapping of cyberspace. University of Chicago Press, 2003.
- 1 2 Ian Spence at psych.utoronto.ca. Accessed 11.2014.