List of cities by population density

Last updated

This is a list of cities worldwide by population density. The population, population density and land area for the cities listed are based on the entire city proper, the defined boundary or border of a city or the city limits of the city. The population density of the cities listed is based on the average number of people living per square mile or per square kilometer. This list does not refer to the population, population density or land area of the greater metropolitan area or urban area, nor particular districts in any of the cities listed.

Contents

Cities by population density

The Philippines, the 12th most populous country in the world, holds the highest number of cities (at 13 entries) in the table below.

Manila, Philippines Manila Skyline (6774800874).jpg
Manila, Philippines
Dhaka, Bangladesh GulshanDhaka.jpg
Dhaka, Bangladesh
Varanasi(Banaras), India Varanasi Munshi Ghat3.jpg
Varanasi(Banaras), India
Levallois-Perret, France Levallois-seine.jpg
Levallois-Perret, France
Kolkata, India Kolkata skyline at night.jpg
Kolkata, India
Guttenberg, New Jersey, United States, just outside New York City Galaxy-towers.jpg
Guttenberg, New Jersey, United States, just outside New York City
Paris, France Paris - Eiffelturm und Marsfeld2.jpg
Paris, France
Colombo, Sri Lanka Beira lake at Nite.jpg
Colombo, Sri Lanka
Entire city of Male, Maldives Male-total.jpg
Entire city of Malé, Maldives


Rank
1
2
3
4
5
6
7
8
9
10
11
12
13
14
15
16
17
18
19
20
21
22
23
24
25
26
27
28
29
30
31
32
33
34
35
36
37
38
39
40
41
42
43
44
45
46
47
48
49
50
51
52
53
54
55
56


City
PopulationAreaDensityCountry
sqkmsqmi/sqkm/sqmi
Flag of Manila.svg   Manila 1,780,148 [1] 38.55 [2] 14.8846,178119,600
Flag of Pateros, Metro Manila.png   Pateros 63,840 [1] 1.76 [3] 0.6836,44794,400
Flag of Mandaluyong.png   Mandaluyong 386,276 [1] 11.06 [3] 4.2734,92590,460
Flag placeholder.svg  Baghdad 6,719,500 [note 1] 204.478.932,87485,140
Flag of Iraq.svg   Iraq
Flag placeholder.svg  Mumbai 19,478,447 [8] 603 [9] 23332,30383,660
Flag of India.svg   India
Flag placeholder.svg  Dhaka 8,906,136306.38118.2929,06975,290
Caloocan City Flag.png   Caloocan 1,583,978 [1] 53.20 [3] 20.5427,98972,490
Armes de la Ville de Port-au-Prince.svg   Port-au-Prince 987,310 [10] 36.0413.9227,39570,950
Flag of Haiti.svg   Haiti
Flag of Bnei Brak.svg   Bnei Brak 193,774 [11] 7.088 [12] 2.73727,33870,810
Flag of Israel.svg   Israel
Blason Levallois-Perret 92.svg   Levallois-Perret 63,436 [13] 2.4 [13] 0.9326,43268,460
Flag of France.svg   France
Blason Le Pre-Saint-Gervais 93.svg   Le Pré-Saint-Gervais 18,121 [14] 0.7 [14] 0.2725,88767,050
Flag of France.svg   France
COA fr Vincennes.svg   Vincennes 48,689 [15] 1.9 [15] 0.7325,62666,370
Flag of France.svg   France
Blason Saint-Mande 94.svg   Saint-Mandé 22,627 [16] 0.9 [16] 0.3525,14165,110
Flag of France.svg   France
Flag placeholder.svg  Makati 582,602 [1] 21.73 [3] 8.3924,34663,060
Flag placeholder.svg  Kolkata 4,496,694 [17] 185 [18] 7124,30662,950
Flag of India.svg   India
Flag of Sint-Josse-ten-Noode.svg   Saint-Josse-ten-Noode 27,548 [19] 1.14 [20] 0.4424,16562,590
Flag of Belgium (civil).svg   Belgium
Flag of Kathmandu, Nepal.svg   Kathmandu 1,183,000 [21] 49.4519.0923,92361,960
Flag of Nepal.svg   Nepal
Flag of Subang Jaya, Selangor.png   Subang Jaya 1,683,589 [22] 70.4127.1923,91161,930
Flag placeholder.svg  Neapoli, Thessaloniki 27,084 [22] 1.170.4523,14959,960
Flag of Greece.svg   Greece
Blason ville fr Montrouge (Hauts-de-Seine).svg   Montrouge 48,410 [23] 2.1 [23] 0.8123,05259,700
Flag of France.svg   France
Flag placeholder.svg  Malé 133,412 [24] 5.8 [25] [26] 2.223,00259,570
Flag placeholder.svg  Guttenberg, New Jersey 11,481 [27] 0.510.196 [28] 22,64558,650
Flag of Damascus.png   Damascus 1,711,000 [29] 2007722,22157,550
Flag of Syria.svg   Syria
Flag placeholder.svg  Malabon 365,525 [1] 15.96 [3] 6.1622,13957,340
Flag placeholder.svg  Navotas 249,463 [1] 11.51 [3] 29.821,67456,140
Flag of Paris with coat of arms.svg   Paris 2,265,886 [30] 105.4 [30] 40.721,49855,680
Flag of France.svg   France
AsmaraMunicipality.jpg   Asmara 963,000 [31] 45 [31] 1721,40055,000
Flag of Eritrea.svg   Eritrea
Flag placeholder.svg  Pasig 755,300 [1] 31.46 [3] 12.1521,29055,100
Escut de Mislata.svg   Mislata 43,756 [32] 2.06 [32] 0.8021,24155,010
Flag of Spain.svg   Spain
Flag of Macau.svg   Macau 643,100 [33] 30.3 [34] 11.721,22454,970
Flag of the People's Republic of China.svg   China
Flag of Kallithea.svg   Kallithea 100,050 [35] 4.75 [35] 1.8321,06354,550
Flag of Greece.svg   Greece
Flag of Nea Smyrni.svg   Nea Smyrni 73,090 [35] 3.52 [35] 1.3620,76453,780
Flag of Greece.svg   Greece
Flag placeholder.svg  Howrah 1,072,161 [8] 51.74 [36] 19.9820,72253,670
Flag of India.svg   India
Flag placeholder.svg  Pasay 416,522 [1] 18.64 [3] 7.2021,07754,590
Flag of San Juan, Metro Manila.png   San Juan, Metro Manila 122,180 [1] 5.87 [3] 2.2720,68753,580
Flag placeholder.svg  Colombo 752,993371420,35152,710
Bandera de l'Hospitalet de Llobregat.svg   L'Hospitalet de Llobregat 252,171 [37] 12.4 [37] 4.820,33652,670
Flag of Spain.svg   Spain
Flag placeholder.svg  Union City, New Jersey 66,455 [27] 3.31.28 [28] 20,01751,840
Flag placeholder.svg  Ghaziabad 2,658,525 [38] 133.351.519,94451,650
Flag of India.svg   India
Flag placeholder.svg  Marikina 450,741 [1] 22.64 [3] 8.7419,90951,560
Flag of Saint-Gilles-lez-Bruxelles.svg   Saint-Gilles, Belgium 50,002 [19] 2.52 [20] 0.9719,84251,390
Flag of Belgium (civil).svg   Belgium
Flag placeholder.svg  West New York, New Jersey 49,708 [27] 2.611.007 [28] 19,06049,400
Flag of Koekelberg.svg   Koekelberg 21,9901.170.4518,79548,680
Flag of Belgium (civil).svg   Belgium
Municipal Flag of Bandung, Indonesia.svg   Bandung 3,075,4781676418,41647,700
Flag placeholder.svg  Las Piñas 588,894 [1] 32.02 [3] 12.3618,39147,630
Flag of Monaco.svg   Monaco 36,950 [39] 2.02 [40] 0.7818,29247,380
Flag of Monaco.svg   Monaco
Blason ville boulogne billancourt.svg   Boulogne-Billancourt 113,085 [41] 6.2 [41] 2.418,24047,200
Flag of France.svg   France
Flag of Givatayim.svg   Giv'atayim 58,500 [42] 3.24 [42] 1.2518,05646,760
Flag of Israel.svg   Israel
Quezon City Flag.svg   Quezon City 2,936,116 [1] 165.53 [3] 63.9117,73845,940
Flag placeholder.svg  Ciudad Nezahualcóyotl 1,110,565 [43] 63.44924.49817,50345,330
Flag of Mexico.svg   Mexico
Escut de Santa Coloma de Gramenet.svg   Santa Coloma de Gramenet 118,821 [44] 72.716,97443,960
Flag of Spain.svg   Spain
Flag placeholder.svg  Chittagong 2,582,401 [45] 1556016,66143,150
Molenbeek-Saint-Jean Belgium.svg   Molenbeek-Saint-Jean 97,4625.892.2716,54742,860
Flag of Belgium (civil).svg   Belgium
Schaerbeek Belgium.svg   Schaerbeek 133,3098.143.1416,37742,420
Flag of Belgium (civil).svg   Belgium
Flag of Seoul.png   Seoul 9,962,393 [46] 605.21 [47] 233.6715,76340,830
Flag of Cairo.svg   Cairo 9,539,673 [48] 606 [49] 23415,74240,770
Flag of Egypt.svg   Egypt

See also

Notes

  1. Estimates of total population differ substantially. The CIA World Factbook estimated the 2018 population of Baghdad at 6,643,000 [4] The Encyclopedia Britannica estimated the 2005 population at 5,904,000; [5] the 2006 Lancet Report states a population of 7,216,050; [6] Mongabay gives a figure of 6,492,200 as of 2002. [7]

Related Research Articles

This article is about the demographic features of the population of Hong Kong, including population density, ethnicity, education level, health of the populace, religious affiliations and other aspects of the population.

This article is about the demographic features of the population of Saint Lucia, including population density, ethnicity, education level, health of the populace, economic status, religious affiliations and other aspects of the population.

The demography of Australia covers basic statistics, most populous cities, ethnicity and religion. The population of Australia is estimated to be 25,607,700 as of 6 February 2020. Australia is the 52nd most populous country in the world and the most populous Oceanian country. Its population is concentrated mainly in urban areas and is expected to exceed 28 million by 2030.

Demographics of Bolivia

The demographic characteristics of the population of Bolivia are known through censuses, with the first in 1826 and the most recent being in 2012. The National Institute of Statistics of Bolivia (INE) has performed this task since 1950. The population of Bolivia in 2012 had reached 10 million for the first time in history. The population density is 9.13 inhabitants per square kilometer, and the overall life expectancy in Bolivia at birth is 68.2 years. The population has steadily risen from the late 1800s to the present time. The natural growth rate of the population is positive, which has been a continuing trend since the 1950s; in 2012, Bolivia's birth rate continued to be higher than the death rate. Bolivia is in the third stage of demographic transition. In terms of age structure, the populations is dominated by the 15–64 segment. The median age of the population is 23.1, and the gender ratio of the total population is 0.99 males per female.

The United States is the third-most populous country in the world, with an estimated population of 329,227,746 as of January 28, 2020. The United States Census Bureau shows a population increase of 0.75% for the twelve-month period ending in July 2012. Though high by industrialized country standards, this is below the world average annual rate of 1.1%. The total fertility rate in the United States estimated for 2018 is 1.73 children per woman, which is below the replacement fertility rate of approximately 2.1.

Urban area Human settlement with high population density and infrastructure of built environment

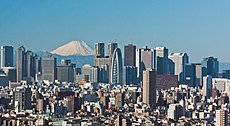
An urban area or urban agglomeration, is a human settlement with high population density and infrastructure of built environment. Urban areas are created through urbanization and are categorized by urban morphology as cities, towns, conurbations or suburbs. In urbanism, the term contrasts to rural areas such as villages and hamlets and in urban sociology or urban anthropology it contrasts with natural environment. The creation of early predecessors of urban areas during the urban revolution led to the creation of human civilization with modern urban planning, which along with other human activities such as exploitation of natural resources leads to human impact on the environment. "Agglomeration effects” are in the list of the main consequences of increased rates of firm creation since due to conditions created by greater level of industrial activity intensity in a given region; favorable environment for human capital development is also being generated simultaneously.

Catholic Church by country Wikimedia list article

The Catholic Church is "the Catholic Communion of Churches, both Roman and Eastern, or Oriental, that are in full communion with the Bishop of Rome ." The church is also known as the People of God, the Body of Christ, the "Temple of the Holy Spirit", among other names. According to Vatican II's Gaudium et spes, the "church has but one sole purpose -- that the kingdom of God may come and the salvation of the human race may be accomplished."

Hinduism by country Hindu citizens in various countries

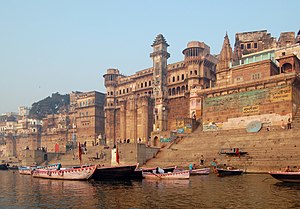
Hinduism has approximately 1.1 billion adherents worldwide. Nepal (81.3%) and India (79.8%) are countries with Hindus being the majority of their respective populations. Along with Christianity (31.5%), Islam (23.2%), Hinduism is one of the three major religions of the world by percentage of population. Hinduism is the third largest religion in the world after Christianity and Islam.

Demographics of Paris overview about the demographics of Paris

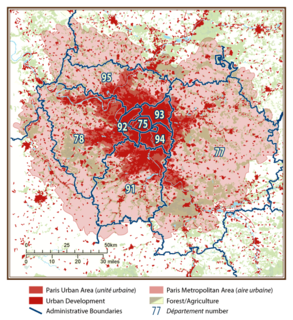
The city of Paris had a population of 2,241,346 people within its administrative city limits as of January 1, 2014. It is surrounded by the Paris unité urbaine, or urban area, the most populous urban area in the European Union. In 2011 the unité urbaine had a population of 10,516,110. The Paris Region, or Île-de-France covers 12,012 square kilometers, and has its own regional council and president. It has a population of 12,005,077 as of January 2014, or 18.2 percent of the population of France.

Paris metropolitan area statistical area corresponding to Paris commuting catchment area

The Paris metropolitan area is a statistical area that describes the reach of commuter movement to and from Paris, France and its surrounding suburbs.

Member states of the Association of Southeast Asian Nations headquarters in Jakarta

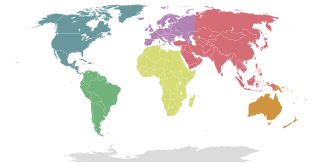
As of 2010, the Association of Southeast Asian Nations (ASEAN) has 10 member states, one candidate member state, and one observer state.

References

  1. 1 2 3 4 5 6 7 8 9 10 11 12 13 Census of Population (2015). Highlights of the Philippine Population 2015 Census of Population. PSA . Retrieved 20 June 2016.
  2. "About Manila". The Official Website of the City of Manila, Philippines. Archived from the original on 24 December 2018. Retrieved 26 October 2019.
  3. 1 2 3 4 5 6 7 8 9 10 11 12 "An Update on the Earthquake Hazards and Risk Assessment of Greater Metropolitan Manila Area" (PDF). Philippine Institute of Volcanology and Seismology. 14 November 2013. Archived from the original (PDF) on 24 June 2016.
  4. "Middle East :: Iraq". CIA World Factbook. Retrieved 19 July 2019.
  5. "Baghdad" Encyclopædia Britannica. Encyclopædia Britannica Online. 19 July 2019.
  6. Gilbert Burnham; Riyadh Lafta; Shannon Doocy; Les Roberts (11 October 2006). "Mortality after the 2003 invasion of Iraq: a cross-sectional cluster sample survey". The Lancet. 368 (9545): 1421–1428. CiteSeerX   10.1.1.88.4036 . doi:10.1016/S0140-6736(06)69491-9. PMID   17055943. Archived from the original on 14 May 2013. Retrieved 14 June 2013. (110 KB)
  7. "Cities and urban areas in Iraq with population over 100,000" Archived 15 November 2006 at the Wayback Machine , Mongabay.com
  8. 1 2 "Cities having population 1 lakh and above, Census 2011" (PDF). The Registrar General & Census Commissioner, India. Retrieved 18 August 2013.
  9. "About MMR". mmrda.maharashtra.gov.in. Mumbai Metropolitan Region Development Authority. Retrieved 2 April 2019.
  10. "Mars 2015 Population Totale, Population de 18 Ans et Plus Menages et Densites Estimes En 2015" (PDF). Institut Haïtien de Statistique et d’Informatique (IHSI). Archived from the original (PDF) on 6 November 2015. Retrieved 19 February 2015.
  11. "List of localities, in Alphabetical order" (PDF). Israel Central Bureau of Statistics. Archived from the original (PDF) on 17 May 2018. Retrieved 25 December 2018.
  12. "Home Page" (in Hebrew). Bnei Brak Municipality. Retrieved 25 December 2018.
  13. 1 2 "Commune de Levallois-Perret (92044)" (in French). INSEE . Retrieved 23 August 2013.
  14. 1 2 "Commune du Pré-Saint-Gervais (93061)" (in French). INSEE . Retrieved 23 August 2013.
  15. 1 2 "Vincennes (94080 – Commune)" (PDF) (in French). INSEE . Retrieved 23 August 2013.[ permanent dead link ]
  16. 1 2 "Commune de Saint-Mandé (94067)" (in French). INSEE . Retrieved 23 August 2013.
  17. "West Bengal". Office of the Registrar General & Census Commissioner, India. Retrieved 26 October 2019.
  18. "Basic Statistics of Kolkata". Kolkata Municipal Corporation. Retrieved 22 August 2013.
  19. 1 2 Direction Générale Institutions et Population, Belgique; Chiffre global de la population par commune, Situation au 1/07/2009 (pdf-file) Archived 19 April 2009 at the Wayback Machine Population as of 1 July 2009. Retrieved on 21 August 2009.
  20. 1 2 GeoHive; Belgium - Brussels Hoofdstedelijk Gewest, Administrative units Archived 1 June 2016 at the Wayback Machine Retrieved on 21 August 2009.
  21. "Kathmandu Population 2019" . Retrieved 14 February 2019.
  22. 1 2 Population and area at the 24 May 2011 Census. Retrieved on 6 August 2017.
  23. 1 2 "Montrouge (92049 – Commune)" (PDF) (in French). INSEE . Retrieved 23 August 2013.[ permanent dead link ]
  24. "TABLE PP 9: TOTAL MALDIVIAN POPULATION BY SEX AND LOCALITY (ATOLLS), 2014". Statistics Maldives. National Bureau of Statistics. Retrieved 23 May 2015.
  25. Malé Land Area Isles: The Provincial Information. Retrieved 17 July 2009
  26. Combination of the islands of Malé, Villingilli, Hulhumalé, and Hulhule (Capital District)
  27. 1 2 3 PEPANNRES – Annual Estimates of the Resident Population: April 1, 2010 to July 1, 2014–2014 Population Estimates for New Jersey municipalities, United States Census Bureau. Accessed 11 April 2016.
  28. 1 2 3 2010 Census Gazetteer Files: New Jersey County Subdivisions, United States Census Bureau. Accessed 11 April 2016.
  29. Central Bureau of Statistics in Syria: Chapter 2: Population & Demographic Indicators Archived 13 February 2011 at the Wayback Machine Table 3: Estimates of Population actually living in Syria on 31 December 2011 by Mohafazat and six (in thousands)
  30. 1 2 "Paris (75056 – Commune)" (in French). INSEE . Retrieved 1 January 2015.
  31. 1 2 "CIA – The World Factbook" . Retrieved 2 September 2012.
  32. 1 2 Población de España – datos y mapas; Todos los Municipios de España (xls, zipped file) Archived 7 April 2010 at the Wayback Machine Population and area 1 January 2009. Retrieved on 21 April 2010.
  33. "Demographic Statistics for the 3rd Quarter 2015". Statistics and Census Service of the Government of Macau SAR. 10 November 2015. Retrieved 10 November 2015.
  34. Current statistics: March 2014- Direcçāo dos Serviços de Cartografia e Cadastro (Cartography and Cadastre Bureau)
  35. 1 2 3 4 "Archived copy" (PDF). Archived from the original (PDF) on 11 October 2011. Retrieved 22 August 2011.CS1 maint: archived copy as title (link) Population and area at the 2011 Census. Retrieved on 22 July 2011.
  36. "Area, Population and density of population in the district of Howrah". Howrah District Government. Archived from the original on 26 February 2013. Retrieved 22 August 2013.
  37. 1 2 "Hospitalet de Llobregat, l' (081017)". Statistical Institute of Catalonia. Retrieved 5 March 2016.
  38. "Urban Agglomerations/Cities having population 1 lakh and above" (PDF). Provisional Population Totals, Census of India 2011. Archived (PDF) from the original on 2 April 2013. Retrieved 7 July 2012.
  39. Monaco Institute of Statistics
  40. French government archives on countries
  41. 1 2 "Commune de Boulogne-Billancourt (92012)" (in French). INSEE . Retrieved 23 August 2013.
  42. 1 2 "Giv'atayim 2016" (PDF) (in Hebrew). Israel Central Bureau of Statistics . Retrieved 14 February 2019.
  43. http://www.microrregiones.gob.mx/zap/datGenerales.aspx?entra=nacion&ent=15&mun=058.Missing or empty |title= (help)
  44. "El municipi en xifres: Santa Coloma de Gramenet". Statistical Institute of Catalonia. Retrieved 30 December 2019.
  45. "Bangladesh: Districts and Cities – Population Statistics in Maps and Charts". www.citypopulation.de. Retrieved 23 December 2018.
  46. "Seoul Population 2019". World Population Review. Retrieved 3 November 2019.
  47. Park, Sohyun (10–14 June 2013). "Healthy Urban Planning in Seoul, Korea" (PDF). World Health Organization. Retrieved 20 November 2019.
  48. "Egypt Data Portal". Egypt Data Portal. Retrieved 3 November 2019.
  49. "Cairo Land Area". City Population. Retrieved 20 October 2017.