| Rank | Country | Million
passengers | Data year | Notes |
|---|
| 1 |  Japan Japan | 25,201 | 2019 [10] | Includes all public and private rail services. For only the JR group rail companies, the figure in 2019 was 9,503 million passengers. [10] |
| 2 |  India India | 6,905 | 2024 [3] | Includes Indian Railways suburban and intercity traffic only, excludes the passengers carried by rapid transit systems. |
| 3 |  China China | 4,312 | 2024 [2] | Excludes rapid transit networks, which handled 23.71 billion passengers in 2019. [11] |
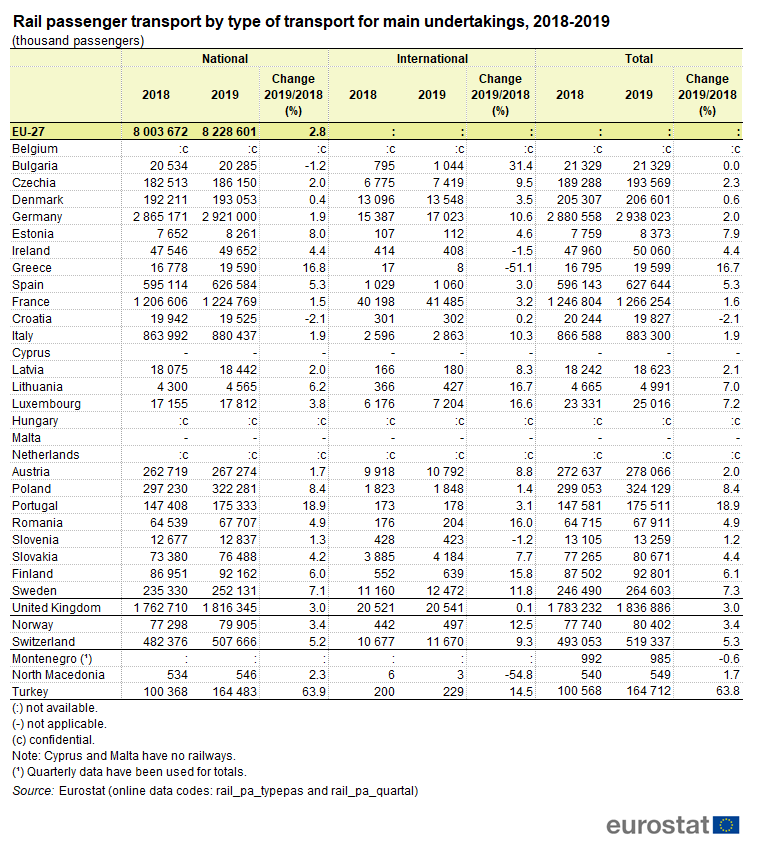
| 4 |  Germany Germany | 2,938 | 2019 [12] |
| 5 |  Brazil Brazil | 2,571 | 2024 [13] | Includes all public and private, urban and long distance rail services. 3.63% increase from the 2.481 billion passengers carried in 2023. In 2024 long distance services alone carried 1.259 million passengers, 0.05% of the total. |
| 6 |  France France | 1,880 | 2019 [14] |
| 7 |  United Kingdom United Kingdom | 1,836.8 | 2019 [12] | The London Underground ("The Tube") had an additional 1.34 billion passengers in 2015-16 [15] |
| 8 |  Russia Russia | 1,157.2 | 2018 | Moscow Metro alone had 2.45 billion passengers in 2014 [16] |
| 9 |  Australia Australia | 1,064.2 | 2018–19 | Combined Urban and Non-Urban Rail Passenger Traffic [17] |
| 10 |  Italy Italy | 883.3 | 2019 [12] |
| 11 |  Spain Spain | 636 | 2019 [18] | Madrid Metro alone had 657.2 million passengers in 2018. [19] |
| 12 |  United States United States | 535 | 2019 | Amtrak had 32.5 million passengers in Fiscal Year 2019 (ending September 30). [20] Among regional systems that report to the American Public Transportation Association, there were 502.5 million commuter rail riders in calendar year 2019. [21] |
| 13 |  Austria Austria | 511 | 2024 [22] | |
| 14 |  Switzerland Switzerland | 507.3 | 2024 [23] | |
| 15 |  Netherlands Netherlands | 474.5 | 2019 | |
| 16 |  Ukraine Ukraine | 440.9 | 2016 [24] | |
| 17 |  Indonesia Indonesia | 429.2 | 2019 [25] | |
| 18 |  Argentina Argentina | 426.2 | 2018 | 423,202,522 Buenos Aires commuter [26]
2,036,792 regional [27]
1,009,357 long distance |
| 19 |  Poland Poland | 324.1 | 2019 [12] | Passengers carried by all rail passenger transport companies in Poland. [28] |
| 20 |  Taiwan Taiwan | 291.84 | 2018 | |
| 21 |  Egypt Egypt | 270 | 2019 [29] | |
| 22 |  South Africa South Africa | 269 | 2017–18 [30] | |
| 23 |  Sweden Sweden | 264.6 | 2019 [12] | Stockholm metro alone had 353 million passengers in 2017. [31] |
| 24 |  Belgium Belgium | 246.94 | 2018 | |
| 25 |  Denmark Denmark | 206.6 | 2019 [12] | |
| 26 |  Czech Republic Czech Republic | 193.5 | 2019 [12] | Prague Metro alone had 435.6 million passengers in 2017. [32] |
| 27 |  Portugal Portugal | 175.5 | 2019 [12] | Lisbon Metro alone had 169 million passengers in 2018. [33] |
| 28 |  Turkey Turkey | 164.7 | 2019 [12] | Istanbul Metro alone had 469.7 million passengers in 2018. [34] |
| 29 |  Sri Lanka Sri Lanka | 138.66 | 2017 [35] | |
| 30 |  South Korea South Korea | 127.84 | 2018 | |
| 31 |  Hungary Hungary | 119 | 2018 | Budapest Metro alone had 409.3 million passengers in 2017. [36] |
| 32 |  Canada Canada | 106.9 | 2019 [37] | Via Rail, Canada's main intercity rail provider, transported 5 million passengers in 2019. Commuter railway systems in and around Toronto, Montreal, and Vancouver transported an additional 101.9 million passengers in 2019. |
| 33 |  Finland Finland | 92.8 | 2019 [38] | 14.9 million / year long-distance
77.9 million / year in Helsinki commuter traffic |
| 34 |  Norway Norway | 80.402 | 2019 [39] | Oslo Metro alone had 122 million passengers in 2018. [40] |
| 35 |  Slovakia Slovakia | 80 | 2019 [12] | |
| 36 |  Belarus Belarus | 79.86 | 2018 | Minsk Metro alone had 293.7 million passengers in 2019. [41] |
| 37 |  Romania Romania | 67.9 | 2019 [12] | Bucharest Metro alone had 178.9 million passengers in 2017. [42] |
| 38 |  Israel Israel | 64.6 | 2017 | The Jerusalem Light Rail carried an additional 42.5 million passengers in 2017. [43] |
| 39 |  Mexico Mexico | 57 | 2018 | Tren Suburbano statistics only [44] |
| 40 |  Pakistan Pakistan | 52.39 | 2018 | |
| 41 |  Ireland Ireland | 50.06 | 2019 [12] | |
| 42 |  Thailand Thailand | 50 | 2017 [45] | Bangkok MRT alone had 113.7 million passengers in 2018. [46] |
| 43 |  Myanmar Myanmar | 48 | 2017 [47] | |
| 44 |  Chile Chile | 47 | 2018 [48] | Santiago Metro alone had 721 million passengers in 2018. [49] |
| 45 |  Malaysia Malaysia | 44.51 | 2018 | |
| 46 |  Tunisia Tunisia | 41 | 2017 | |
| 47 |  Algeria Algeria | 39 | 2018 | Algiers Metro alone had 40 million passengers in 2018. [50] |
| 48 |  Morocco Morocco | 35 | 2018 | |
| 49 |  New Zealand New Zealand | 35 | 2019 [51] | |
| 50 |  Luxembourg Luxembourg | 31.3 | 2024 [52] | |
| 51 |  Iran Iran | 28.09 | 2018 | Tehran Metro alone had 721 million passengers in 2016. [53] |
| 52 |  Kazakhstan Kazakhstan | 22.9 | 2018 | |
| 53 |  Philippines Philippines | 21.84 | 2018 | |
| 54 |  Uzbekistan Uzbekistan | 21.59 | 2018 | Tashkent Metro alone had 71.2 million passengers in 2019. [41] |
| 55 |  Bulgaria Bulgaria | 21.3 | 2019 [12] | Sofia Metro alone had 93.1 million passengers in 2018. [54] |

