North Cornwall (UK Parliament constituency)

Last updated

North Cornwall
County constituency
for the House of Commons
South West England - North Cornwall constituency.svg
Boundary of North Cornwall in South West England
County Cornwall
Electorate 76,741 (2024) [1]
Major settlements Bodmin, Bude, Camelford, Launceston, Padstow and Wadebridge
Current constituency
Created 1918
Member of Parliament Ben Maguire (Liberal Democrat)
SeatsOne
Created from Launceston and St Austell

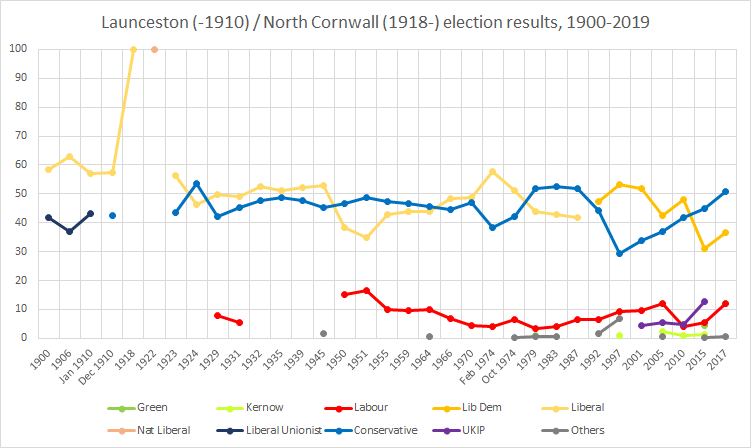
North Cornwall is a constituency [n 1] represented in the House of Commons of the UK Parliament by Ben Maguire, a Liberal Democrat since the 2024 general election. Like all British constituencies, the seat elects one Member of Parliament (MP) by the first past the post system of election at least every five years. The seat was created in 1918. Since 1950, the constituency has been held by MPs from either the Conservative Party or the Liberal Democrats (including the party's predecessor, the Liberal Party).

Contents

History

This constituency was created under the Representation of the People Act 1918. [2]

With exceptions in 1997, 2001 and 2019, the seat's margin of victory has been less than 20% of the vote. It has been consistently fought over between and won by the Conservative Party and the Liberal Democrats' candidate (or predecessor party in the latter case), and can be considered a marginal seat. In 1997 and 2001 the seat turned out strongly overall for the latter party. However, in the 2019 general election, the Conservatives won a large majority of 28.6% over the Liberal Democrat candidate. This was overturned in the 2024 general election when the Liberal Democrats recaptured the seat with a majority of 19.4%.

The highest third-placed (other party) candidate was the 16.4% achieved by Reform UK in 2024. The seat saw three years of defection of its Liberal MP to join the post-World War II Attlee Ministry however in 2015 saw the lowest share of the Labour Party's vote nationally – reinforcing a consistent result by a great majority supporting left-wing politics to vote for a Liberal and later Liberal Democrat at general elections since the seat's inception.

Boundaries

North Cornwall (UK Parliament constituency)
Map of current boundaries
The North Cornwall constituency shown within Cornwall and Devon, 1918-1945 Cornwall North 1918.PNG
The North Cornwall constituency shown within Cornwall and Devon, 1918–1945

1918–1950: The Borough of Launceston, the urban districts of Newquay, Padstow, Stratton and Bude, and Wadebridge, the rural districts of Calstock, Camelford, Launceston, St Columb Major, and Stratton, and parts of the rural districts of Bodmin and Holsworthy (these areas such as Whitstone and Week St Mary were on the Cornish side of the border).

1950–1974: The Borough of Launceston, the urban districts of Bude-Stratton, Newquay, and Padstow, the Rural Districts of Camelford, Launceston, and Stratton, and parts of the rural districts of St Austell and Wadebridge.

1974–1983: The Borough of Launceston, the urban districts of Bude-Stratton and Newquay, the Rural Districts of Camelford, Launceston, and Stratton, and parts of the rural districts of St Austell, and Wadebridge and Padstow.

1983–2010: The District of North Cornwall wards of Allan, Altarnun, Bodmin St Mary's, Bodmin St Petroc, Bude and Poughill, Camelford, Grenville, Lanivet, Launceston North, Launceston South, Lesnewth, North Petherwin, Ottery, Padstow and St Merryn, Penfound, Rumford, St Breward, St Endellion, St Minver, St Teath, South Petherwin, Stratton, Tintagel, Trigg, Wadebridge, and Week St Mary, and the Borough of Restormel wards of Edgcumbe, Gannel, Rialton, St Columb, and St Enoder.

2010–2024: The District of North Cornwall.

2024–present: Further to the 2023 Periodic Review of Westminster constituencies which became effective for the 2024 general election, the constituency is composed of the following electoral divisions of Cornwall (as they existed on 4 May 2021):

The St Columb Major, St Mawgan & St Wenn division was transferred from St Austell and Newquay. Otherwise unchanged.

Historically four borough constituencies lay within the boundaries, three of which were abolished as 'rotten boroughs' by the Reform Act 1832:

Members of Parliament

ElectionMember [4] Party
1918 George Marks Coalition Liberal
1924 Alfred Martyn Williams Conservative
1929 Sir Donald Maclean Liberal
1932 by-election Sir Francis Dyke Acland Liberal
1939 by-election Tom Horabin Liberal
1946 Independent
1947 Labour
1950 Sir Harold Roper Conservative
1959 James Scott-Hopkins Conservative
1966 John Pardoe Liberal
1979 Gerry Neale Conservative [n 2]
1992 Paul Tyler Liberal Democrat
2005 Dan Rogerson Liberal Democrat
2015 Scott Mann Conservative
2024 Ben Maguire Liberal Democrat

Elections

North Cornwall electoral history North Cornwall electoral history.png
North Cornwall electoral history

Elections in the 2020s

General election 2024: North Cornwall [5]
PartyCandidateVotes%±%
Liberal Democrats Ben Maguire 24,094 47.0 +17.1
Conservative Scott Mann 14,13727.6−31.5
Reform UK Rowland O'Connor8,44416.5N/A
Labour Robyn Harris2,9585.8−3.8
Green Lance Symonds1,3352.6+2.4
Heritage Sarah Farrell2770.5N/A
Majority 9,95719.4N/A
Turnout 51,24566.8−4.3
Registered electors 76,741
Liberal Democrats gain from Conservative Swing +24.3

Elections in the 2010s

2019 notional result [6]
PartyVote %
Conservative 31,94159.1
Liberal Democrats 16,15829.9
Labour 5,2019.6
Others6761.3
Green 1010.2
Turnout54,07772.1
Electorate75,034
General election 2019: North Cornwall [7]
PartyCandidateVotes%±%
Conservative Scott Mann 30,671 59.4 +8.7
Liberal Democrats Danny Chambers 15,91930.8−5.8
Labour Joy Bassett4,5168.7−3.4
Liberal Elmars Liepins5721.1N/A
Majority 14,75228.6+14.5
Turnout 51,67873.9−0.1
Conservative hold Swing +7.3
General election 2017: North Cornwall [8]
PartyCandidateVotes%±%
Conservative Scott Mann 25,835 50.7 +5.7
Liberal Democrats Dan Rogerson 18,63536.6+5.4
Labour Joy Bassett6,15112.1+6.7
CPA John Allman1850.4+0.3
Socialist Labour Robert Hawkins1380.3N/A
Majority 7,20014.1+0.3
Turnout 50,94474.0+2.2
Conservative hold Swing +0.3
General election 2015: North Cornwall [9]
PartyCandidateVotes%±%
Conservative Scott Mann 21,689 45.0 +3.3
Liberal Democrats Dan Rogerson 15,06831.2−16.9
UKIP Julie Lingard6,12112.7+7.8
Labour John Whitby2,6215.4+1.2
Green Amanda Pennington2,0634.3N/A
Mebyon Kernow Jerry Jefferies6311.3+0.2
Restore the Family for Children's SakeJohn Allman520.1N/A
Majority 6,62113.8N/A
Turnout 48,24571.8+3.6
Conservative gain from Liberal Democrats Swing +10.1
General election 2010: North Cornwall [10] [11]
PartyCandidateVotes%±%
Liberal Democrats Dan Rogerson 22,512 48.1 +5.7
Conservative Sian Flynn19,53141.7+6.3
UKIP Miriel O'Connor2,3004.9−0.8
Labour Janet Hulme1,9714.2−8.3
Mebyon Kernow Joanie Willet5301.1−2.1
Majority 2,9816.4+0.9
Turnout 46,84468.2+3.7
Liberal Democrats hold Swing −0.3

Elections in the 2000s

General election 2005: North Cornwall [12]
PartyCandidateVotes%±%
Liberal Democrats Dan Rogerson 23,842 42.6 −9.4
Conservative Mark Formosa20,76637.1+3.3
Labour David Acton6,63611.9+2.2
UKIP David Campbell-Bannerman 3,0635.5+1.1
Mebyon Kernow Dick Cole 1,3512.4N/A
Veritas Alan Eastwood3240.6N/A
Majority 3,0765.5−12.7
Turnout 55,98264.5+0.7
Liberal Democrats hold Swing −6.4
General election 2001: North Cornwall [13]
PartyCandidateVotes%±%
Liberal Democrats Paul Tyler 28,082 52.0 −1.2
Conservative John Weller18,25033.8+4.3
Labour Michael Goodman5,2579.7+0.3
UKIP Steve Protz2,3944.4N/A
Majority 9,83218.2−5.5
Turnout 53,98363.8−9.3
Liberal Democrats hold Swing −2.7

Elections in the 1990s

General election 1997: North Cornwall [14]
PartyCandidateVotes%±%
Liberal Democrats Paul Tyler 31,100 53.2 +5.8
Conservative Nigel Linacre17,25329.5−14.8
Labour Anne Lindo5,5239.4+2.8
Referendum Felicity Odam3,6366.2N/A
Mebyon Kernow John Bolitho 6451.1N/A
Liberal Rif Winfield1860.3−0.8
Natural Law Nicholas Creswell1520.3+0.1
Majority 13,84723.7+10.6
Turnout 58,49573.1−9.0
Liberal Democrats hold Swing +10.3 [n 3]
General election 1992: Cornwall North [15] [16]
PartyCandidateVotes%±%
Liberal Democrats Paul Tyler 29,696 47.4 +5.5
Conservative Gerry Neale 27,77544.3−7.4
Labour Frank Jordan4,1036.6+0.2
Liberal Philip Andrews6781.1N/A
Independent Geoffrey Rowe2760.4N/A
Natural Law Robyn Treadwell1120.2N/A
Majority 1,9213.1N/A
Turnout 62,64082.1+2.3
Liberal Democrats gain from Conservative Swing +6.5

Elections in the 1980s

General election 1987: Cornwall North [17]
PartyCandidateVotes%±%
Conservative Gerry Neale 29,862 51.7 −0.7
Liberal Michael Mitchell24,18041.9−1.1
Labour Christine Herries3,7196.4+2.5
Majority 5,6829.8+0.4
Turnout 57,76179.8−0.6
Conservative hold Swing +0.9
General election 1983: Cornwall North [18]
PartyCandidateVotes%±%
Conservative Gerry Neale 28,146 52.4 +0.8
Liberal David Chambers23,08743.0−0.8
Labour James Hayday2,0963.9−0.7
Cornish Nationalist James Whetter 3640.7N/A
Majority 5,0599.4+1.6
Turnout 53,69380.4
Conservative hold Swing +0.8

Elections in the 1970s

General election 1979: Cornwall North
PartyCandidateVotes%±%
Conservative Gerry Neale 24,489 51.65 +9.65
Liberal John Pardoe 20,74243.75−7.50
Labour R.B. Tremlett1,5143.19−3.21
Ecology J. Faull4420.93N/A
National Front R. Bridgwater2240.47N/A
Majority 3,7477.90N/A
Turnout 47,41186.1+5.6
Conservative gain from Liberal Swing +8.58
General election October 1974: Cornwall North
PartyCandidateVotes%±%
Liberal John Pardoe 21,368 51.25 −6.65
Conservative Gerry Neale 17,51242.00
Labour R. Tremlett2,6636.40
Anti Party SystemR.J. Bridgwater1480.35N/A
Majority 3,8569.25
Turnout 41,69180.52
Liberal hold Swing
General election February 1974: Cornwall North
PartyCandidateVotes%±%
Liberal John Pardoe 25,667 57.90
Conservative Trixie Gardner 16,93838.21
Labour J.B. Benjamin1,7263.89
Majority 8,72919.69
Turnout 44,33186.29
Liberal hold Swing
General election 1970: Cornwall North
PartyCandidateVotes%±%
Liberal John Pardoe 19,863 48.64 +0.14
Conservative Simon James Day19,22347.10+2.56
Labour Ernest William J Hill1,7414.26−2.69
Majority 6301.54−2.42
Turnout 40,82785.11−2.42
Liberal hold Swing -1.21

Elections in the 1960s

General election 1966: Cornwall North
PartyCandidateVotes%±%
Liberal John Pardoe 18,460 48.50 +4.69
Conservative James Scott-Hopkins 16,95244.54−1.14
Labour Reginald S. Wills2,6476.95−2.82
Majority 1,5083.96N/A
Turnout 38,05987.53
Liberal gain from Conservative Swing
General election 1964: Cornwall North
PartyCandidateVotes%±%
Conservative James Scott-Hopkins 16,352 45.68
Liberal Charles Meddon Karslake Bruton15,68343.81
Labour Raymond S Dash3,4979.77
IndependentEdward George C Voullaire2650.74N/A
Majority 6691.87
Turnout 35,79783.10
Conservative hold Swing

Elections in the 1950s

General election 1959: Cornwall North
PartyCandidateVotes%±%
Conservative James Scott-Hopkins 16,701 46.7 −0.7
Liberal Edwin Malindine 15,71243.9+1.0
Labour William Carlo Ferman3,3899.5−0.3
Majority 9892.8−1.7
Turnout 35,80283.7+1.4
Conservative hold Swing
General election 1955: Cornwall North
PartyCandidateVotes%±%
Conservative Harold Roper 16,824 47.38
Liberal Edwin Malindine 15,22042.86
Labour Vernon Eric Cornford3,4659.76
Majority 1,6044.52
Turnout 35,50982.30
Conservative hold Swing
General election 1951: Cornwall North
PartyCandidateVotes%±%
Conservative Harold Roper 18,009 48.77
Liberal Dingle Foot 12,86934.85
Labour William Carlo Ferman6,04916.38
Majority 5,14013.92
Turnout 36,92785.71
Conservative hold Swing
General election 1950: Cornwall North
PartyCandidateVotes%±%
Conservative Harold Roper 17,059 46.6 +1.2
Liberal Dingle Foot 13,98738.3−14.6
Labour Herbert Leslie Richardson5,52115.1N/A
Majority 3,0728.3N/A
Turnout 36,56785.9+13.2
Conservative gain from Liberal Swing

Elections in the 1940s

General election 1945: Cornwall North
PartyCandidateVotes%±%
Liberal Tom Horabin 18,836 52.9 +1.6
Conservative Thomas Percy Fulford16,17145.4−3.3
Independent Labour John Hazlewood Worrall6261.8N/A
Majority 2,6657.5+4.9
Turnout 35,63372.7−7.2
Liberal hold Swing

Elections in the 1930s

1939 North Cornwall by-election
PartyCandidateVotes%±%
Liberal Tom Horabin 17,072 52.2 +0.9
Conservative Edward Robin Whitehouse15,60847.8−0.9
Majority 1,4644.4+1.8
Turnout 32,68079.3−0.6
Liberal hold Swing +0.9
1935 general election: North Cornwall
PartyCandidateVotes%±%
Liberal Francis Dyke Acland 16,872 51.3 +2.2
Conservative Edward Robin Whitehouse16,03648.7+3.4
Majority 8362.6−1.2
Turnout 32,90879.9−5.8
Liberal hold Swing -1.1
1932 North Cornwall by-election
PartyCandidateVotes%±%
Liberal Francis Dyke Acland 16,933 52.4 +3.3
Conservative Alfred Martyn Williams 15,38747.6+2.3
Majority 1,5464.8+1.0
Turnout 32,32080.8−4.9
Liberal hold Swing
1931 general election: North Cornwall
PartyCandidateVotes%±%
Liberal Donald Maclean 16,867 49.1 −0.6
Conservative Alfred Martyn Williams 15,52645.3+3.0
Labour Arthur Bennett1,9075.6−2.4
Majority 1,3413.8−3.6
Turnout 35,30085.7−0.4
Liberal hold Swing

Elections in the 1920s

Sir Donald Maclean Sir Donald Maclean.jpg
Sir Donald Maclean
1929 general election: North Cornwall
PartyCandidateVotes%±%
Liberal Donald Maclean 16,586 49.7 +3.3
Unionist Alfred Martyn Williams 14,09542.3−11.3
Labour F. E. Church2,6548.0N/A
Majority 2,4917.4N/A
Turnout 33,33586.1+8.1
Liberal gain from Unionist Swing +7.3
General election 1924: North Cornwall
PartyCandidateVotes%±%
Unionist Alfred Martyn Williams 12,639 53.6 +10.1
Liberal George Marks 10,92746.4−10.1
Majority 1,7127.2N/A
Turnout 23,56678.0+2.4
Unionist gain from Liberal Swing
General election 1923: North Cornwall
PartyCandidateVotes%±%
Liberal George Marks 12,434 56.5 N/A
Unionist Charles Alexander Petrie9,58143.5N/A
Majority 2,85313.0N/A
Turnout 22,01575.6N/A
Liberal hold Swing N/A
General election 1922: North Cornwall
PartyCandidateVotes%±%
National Liberal George Marks Unopposed N/AN/A
National Liberal hold

Elections in the 1910s

General election 1918: North Cornwall
PartyCandidateVotes%±%
C Liberal George Marks Unopposed
Liberal win (new seat)
Cindicates candidate endorsed by the coalition government.

See also

Notes

  1. A county constituency (for the purposes of election expenses and type of returning officer)
  2. Knighted in 1991
  3. The largest two-party swing in this election was (Con-Ref): 10.5%

References

  1. "Result for North Cornwall constituency – 4 July 2024 – Cornwall Council". www.cornwall.gov.uk. Retrieved 10 July 2024.
  2. "The Representation of the people act, 1918 : with explanatory notes". https://archive.org . 1918.{{cite journal}}: External link in |journal= (help)
  3. "The Parliamentary Constituencies Order 2023". Schedule 1 Part 7 South West region.
  4. Leigh Rayment's Historical List of MPs – Constituencies beginning with "C" (part 6)
  5. "Result for North Cornwall constituency – 4 July 2024 – Cornwall Council". www.cornwall.gov.uk. Retrieved 10 July 2024.
  6. "Notional results for a UK general election on 12 December 2019". Rallings & Thrasher, Professor David Denver (Scotland), Nicholas Whyte (NI) for Sky News, PA, BBC News and ITV News. UK Parliament . Retrieved 11 July 2024.
  7. "Cornwall North". BBC News. 2019. Archived from the original on 6 February 2020. Retrieved 6 February 2020.
  8. "Cornwall North parliamentary constituency". BBC News.
  9. "Election Data 2015". Electoral Calculus. Archived from the original on 17 October 2015. Retrieved 17 October 2015.
  10. "Election Data 2010". Electoral Calculus. Archived from the original on 26 July 2013. Retrieved 17 October 2015.
  11. Lavery, Kevin (20 April 2010). "North Cornwall statement of persons nominated and notice of poll" (MSWord). Acting Returning Officer. Cornwall Council. Retrieved 20 April 2010.
  12. "Election Data 2005". Electoral Calculus. Archived from the original on 15 October 2011. Retrieved 18 October 2015.
  13. "Election Data 2001". Electoral Calculus. Archived from the original on 15 October 2011. Retrieved 18 October 2015.
  14. "Election Data 1997". Electoral Calculus. Archived from the original on 15 October 2011. Retrieved 18 October 2015.
  15. "Election Data 1992". Electoral Calculus. Archived from the original on 15 October 2011. Retrieved 18 October 2015.
  16. "Politics Resources". Election 1992. Politics Resources. 9 April 1992. Archived from the original on 24 July 2011. Retrieved 6 December 2010.
  17. "Election Data 1987". Electoral Calculus. Archived from the original on 15 October 2011. Retrieved 18 October 2015.
  18. "Election Data 1983". Electoral Calculus. Archived from the original on 15 October 2011. Retrieved 18 October 2015.

Sources

50°41′20″N4°35′38″W / 50.689°N 4.594°W / 50.689; -4.594