Statistical area (United States)

Last updated

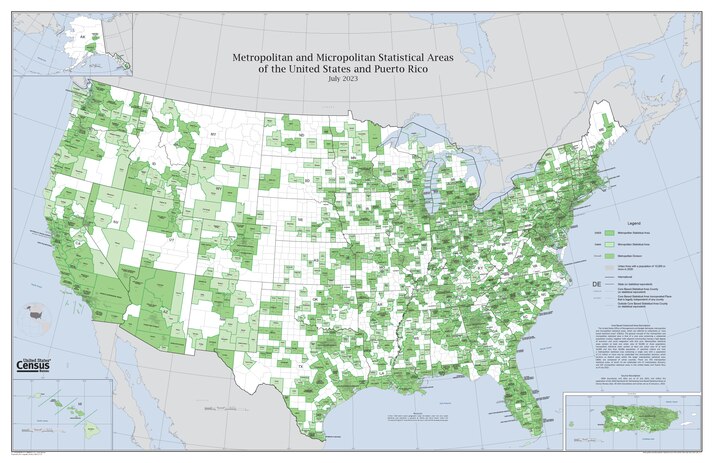
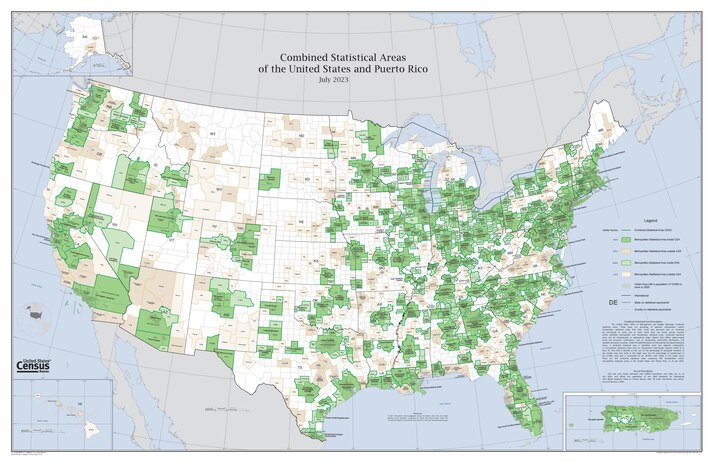
The United States federal government defines and delineates the nation's metropolitan areas for statistical purposes, using a set of standard statistical area definitions. As of 2023, the U.S. Office of Management and Budget (OMB) defined and delineated 393 metropolitan statistical areas (MSAs) and 542 micropolitan statistical areas (μSAs) in the United States and Puerto Rico. [1] Many of these 935 MSAs and μSAs are, in turn, components of larger combined statistical areas (CSAs) consisting of adjacent MSAs and μSAs that are linked by commuting ties; as of 2023, 582 metropolitan and micropolitan areas are components of the 184 defined CSAs.

Contents

Metropolitan and micropolitan statistical areas are defined as consisting of one or more adjacent counties or county equivalents with at least one urban core area meeting relevant population thresholds, plus adjacent territory that has a high degree of social and economic integration with the core, as measured by commuting ties. A metropolitan statistical area has at least one core with a population of at least 50,000. In a micropolitan statistical area, the largest core has a population of at least 10,000 but less than 50,000.

Maps

An enlargeable map of the 935 core-based statistical areas (MSAs and mSAs) of the 50 states, the District of Columbia, and Puerto Rico. The 393 MSAs are shown in medium green
.mw-parser-output .legend{page-break-inside:avoid;break-inside:avoid-column}.mw-parser-output .legend-color{display:inline-block;min-width:1.25em;height:1.25em;line-height:1.25;margin:1px 0;text-align:center;border:1px solid black;background-color:transparent;color:black}.mw-parser-output .legend-text{}
. The 542 mSAs are shown in light green
. CBSA WallMap Jul2023.pdf
An enlargeable map of the 935 core-based statistical areas (MSAs and μSAs) of the 50 states, the District of Columbia, and Puerto Rico. The 393 MSAs are shown in medium green  . The 542 μSAs are shown in light green  .
An enlargeable map of the 184 combined statistical areas (CSAs) of the 50 states, the District of Columbia, and Puerto Rico, shown in shades of green. The metropolitan statistical areas (MSAs) outside CSAs are shown in medium tan. The micropolitan statistical areas (mSAs) outside CSAs are shown in light tan. CSA WallMap Jul2023.pdf
An enlargeable map of the 184 combined statistical areas (CSAs) of the 50 states, the District of Columbia, and Puerto Rico, shown in shades of green. The metropolitan statistical areas (MSAs) outside CSAs are shown in medium tan. The micropolitan statistical areas (μSAs) outside CSAs are shown in light tan.

Types and distribution

The sortable table below shows the number of combined, metropolitan and micropolitan statistical areas in each of the U.S. states, the District of Columbia, and Puerto Rico as of 2023. For each jurisdiction, it lists:

  1. Total number of delineated areas wholly or partially in the named jurisdiction [1]
  2. The number of CSAs wholly or partially in the jurisdiction [1]
  3. The number of core-based statistical areas (i.e., MSAs and μSAs) wholly or partially in the jurisdiction [1]
  4. The number of MSAs wholly or partially in the jurisdiction [1]
  5. The number of μSAs wholly or partially in the jurisdiction [1]
Number of statistical areas in the United States and Puerto Rico [lower-alpha 1]

JurisdictionDelineated areas CSAs Core-based areas MSAs μSAs
Alabama [2] 359261313
Alaska 40422
Arizona 1321174
Arkansas [2] 25421714
California 427352510
Colorado 20317710
Connecticut [2] 92752
Delaware [2] 41321
Florida [2] 35728226
Georgia [2] 467391524
Hawaiʻi 40422
Idaho [2] 22517710
Illinois [2] 4714331221
Indiana [2] 5010401525
Iowa [2] 31724915
Kansas [2] 25322715
Kentucky [2] 32824915
Louisiana [2] 25619109
Maine 51431
Maryland [2] 1331064
Massachusetts [2] 1221073
Michigan [2] 438351619
Minnesota [2] 34628919
Mississippi [2] 27621417
Missouri [2] 31625718
Montana 70752
Nebraska [2] 1631349
Nevada 102835
New Hampshire [2] 82624
New Jersey [2] 93660
New Mexico 19217413
New York [2] 347271314
North Carolina [2] 489391524
North Dakota [2] 91844
Ohio [2] 5511441529
Oklahoma [2] 28622517
Oregon [2] 24420812
Pennsylvania [2] 4812362016
Rhode Island [2] 21110
South Carolina [2] 20416106
South Dakota [2] 1421239
Tennessee [2] 347271017
Texas [2] 8013672641
Utah [2] 1211156
Vermont [2] 82615
Virginia [2] 19415114
Washington [2] 296231310
West Virginia [2] 20515105
Wisconsin [2] 4011291514
Wyoming [2] 1001028
District of Columbia [3] 21110
United States 1106181925387538
Puerto Rico 1331064
United States & Puerto Rico 1119184935393542

See also

Notes

  1. Because many metropolitan and micropolitan areas overlap jurisdictional boundaries, columns are not additive.

Related Research Articles

In the United States, a metropolitan statistical area (MSA) is a geographical region with a relatively high population density at its core and close economic ties throughout the region. Such regions are not legally incorporated as a city or town would be and are not legal administrative divisions like counties or separate entities such as states. As a result, sometimes the precise definition of a given metropolitan area will vary between sources. The statistical criteria for a standard metropolitan area were defined in 1949 and redefined as a metropolitan statistical area in 1983.

<span class="mw-page-title-main">Micropolitan statistical area</span> Statistical area of the United States

United States micropolitan statistical areas, as defined by the Office of Management and Budget (OMB), are labor market and statistical areas in the United States centered on an urban cluster with a population of at least 10,000 but fewer than 50,000 people. The micropolitan area designation was created in 2003. Like the better-known metropolitan statistical areas, a micropolitan area is a geographic entity used for statistical purposes based on counties and county equivalents. On July 21, 2023, the Office of Management and Budget released revised delineations of the various CBSAs in the United States, which recognized 542 micropolitan areas in the United States, four of which are in Puerto Rico.

Combined statistical area (CSA) is a United States Office of Management and Budget (OMB) term for a combination of adjacent metropolitan (MSA) and micropolitan statistical areas (μSA) across the 50 U.S. states and the territory of Puerto Rico that can demonstrate economic or social linkage. CSAs were first designated in 2003. OMB defines a CSA by various combinations of adjacent metropolitan and micropolitan areas with economic ties measured by commuting patterns. CSAs retain their own designations as metropolitan or micropolitan statistical areas in their respective larger combined statistical areas.

The U.S. State of Illinois currently has 47 statistical areas that have been delineated by the Office of Management and Budget (OMB). On July 21, 2023, the OMB delineated 14 combined statistical areas, 12 metropolitan statistical areas, and 21 micropolitan statistical areas in Illinois. As of 2023, the largest of these is the Chicago-Naperville, IL-IN-WI CSA, comprising the area around Illinois' largest city, Chicago.

The U.S. State of Ohio currently has 55 statistical areas that have been delineated by the Office of Management and Budget (OMB). On July 21, 2023, the OMB delineated 11 combined statistical areas, 15 metropolitan statistical areas, and 29 micropolitan statistical areas in Ohio. As of 2023, the largest of these is the Cleveland-Akron-Canton, OH CSA, comprising Cleveland and other cities in the northeast region of the state.

The United States Commonwealth of Pennsylvania currently has 48 statistical areas that have been delineated by the Office of Management and Budget (OMB). On July 21, 2023, the OMB delineated 12 combined statistical areas, 16 metropolitan statistical areas, and 20 micropolitan statistical areas in Pennsylvania. As of 2023, the largest of these is the Philadelphia-Reading-Camden, PA-NJ-DE-MD CSA, comprising the area around the state's largest city of Philadelphia in the southeast region of the state.

The U.S. state of New York currently has 34 statistical areas that have been delineated by the Office of Management and Budget (OMB). On July 21, 2023, the OMB delineated seven combined statistical areas, 13 metropolitan statistical areas and 14 micropolitan statistical areas in New York. As of 2023, the largest of these is the New York-Newark, NY-NJ-CT-PA CSA, which includes New York City and its surrounding suburbs; with over 21 million people, it is the largest primary statistical area in the United States.

The U.S. State of Connecticut currently has nine statistical areas that have been delineated by the Office of Management and Budget (OMB). On July 21, 2023, the OMB delineated two combined statistical areas, five metropolitan statistical areas, and two micropolitan statistical areas in Connecticut. As of 2023, the largest of these in the state is the New Haven-Hartford-Waterbury, CT CSA, encompassing the entire state outside of the Bridgeport-Stamford-Danbury, CT MSA in the southwest.

The U.S. State of Wisconsin currently has 40 statistical areas that have been delineated by the Office of Management and Budget (OMB). On July 21, 2023, the OMB delineated 11 combined statistical areas, 15 metropolitan statistical areas, and 14 micropolitan statistical areas in Wisconsin. As of 2023, the largest of these is the Milwaukee-Racine-Waukesha, WI CSA, comprising the area around the Wisconsin's largest city, Milwaukee.

The U.S. State of Hawaiʻi currently has four statistical areas that have been delineated by the Office of Management and Budget (OMB). On July 21, 2023, the OMB delineated two metropolitan statistical areas and two micropolitan statistical areas in Hawaiʻi. As of 2023, the most populous of these is the Urban Honolulu, HI MSA, anchored by Hawaiʻi's capital and largest city, Honolulu, on the island of Oahu.

The U.S. State of Montana currently has seven statistical areas that have been delineated by the Office of Management and Budget (OMB). On July 21, 2023, the OMB delineated five metropolitan statistical areas and two micropolitan statistical areas in Montana. As of 2023, the largest of these is the Billings, MT MSA, comprising the area surrounding Montana's largest city of Billings.

The U.S. State of Alabama currently has 35 statistical areas that have been delineated by the Office of Management and Budget (OMB).

The United States District of Columbia(Washington, D.C.) is the primary city of two statistical areas that have been delineated by the Office of Management and Budget (OMB). On July 21, 2023, the OMB delineated the Washington-Arlington-Alexandria, DC-VA-MD-WV MSA and the more extensive Washington-Baltimore-Arlington, DC-MD-VA-WV-PA CSA.

The U.S. State of Virginia currently has 19 statistical areas that have been delineated by the Office of Management and Budget (OMB). On July 21, 2023, the OMB delineated four combined statistical areas, 11 metropolitan statistical areas, and four micropolitan statistical areas in Virginia. As of 2023, the largest of these is the Washington-Baltimore-Arlington, DC-MD-VA-WV-PA CSA, comprising Washington, D.C. and its suburbs.

The U.S. State of West Virginia currently has 20 statistical areas that have been delineated by the Office of Management and Budget (OMB). On July 21, 2023, the OMB delineated five combined statistical areas, 10 metropolitan statistical areas, and five micropolitan statistical areas in West Virginia. As of 2023, the largest of these is the Charleston-Huntington-Ashland, WV-OH-KY CSA, which includes West Virginia's capital and largest city, Charleston.

The U.S. State of Nebraska currently has 16 statistical areas that have been delineated by the Office of Management and Budget (OMB). On July 21, 2023, the OMB delineated three combined statistical areas, four metropolitan statistical areas, and nine micropolitan statistical areas in Nebraska. As of 2023, the largest of these is the Omaha-Fremont, NE-IA CSA, comprising the area around Nebraska's largest city, Omaha.

The U.S. State of Oregon currently has 24 statistical areas that have been delineated by the Office of Management and Budget (OMB). On July 21, 2023, the OMB delineated four combined statistical areas, eight metropolitan statistical areas, and 12 micropolitan statistical areas in Oregon. As of 2023, the largest of these is the Portland-Vancouver-Salem, OR-WA CSA, anchored by Oregon's largest city, Portland and including its capital, Salem.

The U.S. State of South Carolina currently has 20 statistical areas that have been delineated by the Office of Management and Budget (OMB). On July 21, 2023, the OMB delineated four combined statistical areas, ten metropolitan statistical areas, and six micropolitan statistical areas in South Carolina. As of 2023, the largest of these is the Greenville-Spartanburg-Anderson, SC CSA, comprising the area around Greenville in the state's Upcountry.

The Commonwealth of Puerto Rico currently has 13 statistical areas that have been delineated by the United States Office of Management and Budget (OMB). On July 21, 2023, the OMB delineated three combined statistical areas, six metropolitan statistical areas, and four micropolitan statistical areas in Puerto Rico. As of 2023, the largest of these is the San Juan-Bayamón, PR CSA, comprising the area around San Juan, Puerto Rico's capital and largest city.

References

  1. 1 2 3 4 5 6 "OMB Bulletin No. 23-01: Revised Delineations of Metropolitan Statistical Areas, Micropolitan Statistical Areas, and Combined Statistical Areas, and Guidance on Uses of the Delineations of These Areas" (PDF). United States Office of Management and Budget. July 21, 2023. Retrieved May 2, 2024.
  2. 1 2 3 4 5 6 7 8 9 10 11 12 13 14 15 16 17 18 19 20 21 22 23 24 25 26 27 28 29 30 31 32 33 34 35 36 37 38 39 40 41 This state shares one or more statistical areas with one or more other states.
  3. The District of Columbia shares both its statistical areas with nearby states.