North Dakota statistical areas

Last updated
An enlargeable map of the eight core-based statistical areas in North Dakota. North Dakota CBSAs 2020.png
An enlargeable map of the eight core-based statistical areas in North Dakota .

The U.S. State of North Dakota currently has nine statistical areas that have been delineated by the Office of Management and Budget (OMB). On July 21, 2023, the OMB delineated one combined statistical area, four metropolitan statistical areas, and four micropolitan statistical areas in North Dakota. [1]

Contents

Statistical areas

The Office of Management and Budget (OMB) has designated more than 1,000 statistical areas for the United States and Puerto Rico. [2] These statistical areas are important geographic delineations of population clusters used by the OMB, the United States Census Bureau, planning organizations, and federal, state, and local government entities.

The OMB defines a core-based statistical area (commonly referred to as a CBSA) as "a statistical geographic entity consisting of the county or counties (or county-equivalents) associated with at least one core [lower-alpha 1] of at least 10,000 population, plus adjacent counties having a high degree of social and economic integration with the core as measured through commuting ties with the counties containing the core." [2] The OMB further divides core-based statistical areas into metropolitan statistical areas (MSAs) that have "a population of at least 50,000" and micropolitan statistical areas (μSAs) that have "a population of at least 10,000, but less than 50,000." [2]

The OMB defines a combined statistical area (CSA) as "a geographic entity consisting of two or more adjacent core-based statistical areas with employment interchange measures [lower-alpha 2] of at least 15%." [2] The primary statistical areas (PSAs) include all combined statistical areas and any core-based statistical area that is not a constituent of a combined statistical area.

Table

The table below describes the 9 United States statistical areas and 53 counties of the State of North Dakota with the following information: [3]

  1. The combined statistical area (CSA) as designated by the OMB. [1]
  2. The CSA population according to 2019 US Census Bureau population estimates. [4]
  3. The core based statistical area (CBSA) [2] as designated by the OMB. [1]
  4. The CBSA population according to 2019 US Census Bureau population estimates [4]
  5. The county name
  6. The county population according to 2019 US Census Bureau population estimates [4]
The 9 United States statistical areas and 53 counties of the State of North Dakota

Combined Statistical Area2020 PopulationCore Based Statistical Area2020 PopulationCounty2020 Population
Fargo-Wahpeton, ND-MN CSA 272,878
201,054
Fargo, ND-MN MSA 249,843
184,525
Cass County, North Dakota 184,525
Clay County, Minnesota 65,318
Wahpeton, ND-MN μSA 23,035
16,529
Richland County, North Dakota 16,529
Wilkin County, Minnesota 6,506
none Bismarck, ND MSA 133,626 Burleigh County, North Dakota 98,458
Morton County, North Dakota 33,291
Oliver County, North Dakota 1,877
Minot, ND MSA 77,546 Ward County, North Dakota 69,919
McHenry County, North Dakota 5,345
Renville County, North Dakota 2,282
Grand Forks, ND-MN MSA 104,362
73,170
Grand Forks County, North Dakota 73,170
Polk County, Minnesota 31,192
Williston, ND μSA 40,950 Williams County, North Dakota 40,950
Dickinson, ND μSA 38,686 Stark County, North Dakota 33,646
Dunn County, North Dakota 4,095
Billings County, North Dakota 945
Jamestown, ND μSA 21,593 Stutsman County, North Dakota 21,593
none McKenzie County, North Dakota 14,704
Rolette County, North Dakota 12,187
Ramsey County, North Dakota 11,605
Barnes County, North Dakota 10,853
Walsh County, North Dakota 10,563
Mountrail County, North Dakota 9,809
McLean County, North Dakota 9,771
Mercer County, North Dakota 8,350
Traill County, North Dakota 7,997
Pembina County, North Dakota 6,844
Bottineau County, North Dakota 6,379
Benson County, North Dakota 5,964
Ransom County, North Dakota 5,703
Dickey County, North Dakota 4,999
LaMoure County, North Dakota 4,093
Pierce County, North Dakota 3,990
Wells County, North Dakota 3,982
Sioux County, North Dakota 3,898
Sargent County, North Dakota 3,862
Cavalier County, North Dakota 3,704
Foster County, North Dakota 3,397
Emmons County, North Dakota 3,301
Nelson County, North Dakota 3,015
Bowman County, North Dakota 2,993
McIntosh County, North Dakota 2,530
Hettinger County, North Dakota 2,489
Kidder County, North Dakota 2,394
Eddy County, North Dakota 2,347
Griggs County, North Dakota 2,306
Grant County, North Dakota 2,301
Burke County, North Dakota 2,201
Adams County, North Dakota 2,200
Divide County, North Dakota 2,195
Towner County, North Dakota 2,162
Logan County, North Dakota 1,876
Steele County, North Dakota 1,798
Golden Valley County, North Dakota 1,736
Sheridan County, North Dakota 1,265
Slope County, North Dakota 706
State of North Dakota 779,094

See also

Notes

  1. The OMB defines a core as "a densely settled concentration of population, comprising an Urban Area (of 10,000 or more population) delineated by the Census Bureau, around which a core-based statistical area is delineated." [2]
  2. The OMB defines the employment interchange measure as "the sum of the percentage of workers living in the smaller entity who work in the larger entity plus the percentage of employment in the smaller entity that is accounted for by workers who reside in the larger entity." [2]

Related Research Articles

<span class="mw-page-title-main">Indiana statistical areas</span> Indiana statistical areas

The U.S. state of Indiana currently has 51 statistical areas that have been delineated by the Office of Management and Budget (OMB). On March 6, 2020, the OMB delineated ten combined statistical areas, 15 metropolitan statistical areas, and 26 micropolitan statistical areas in Indiana.
<span class="mw-page-title-main">Illinois statistical areas</span> Illinois statistical areas

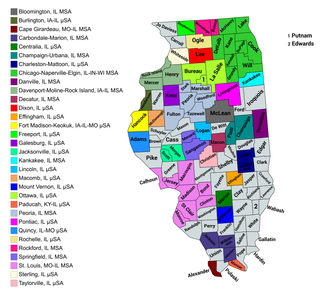
The U.S. State of Illinois currently has 43 statistical areas that have been delineated by the Office of Management and Budget (OMB). On March 6, 2020, the OMB delineated 11 combined statistical areas, 13 metropolitan statistical areas, and 19 micropolitan statistical areas in Illinois.
<span class="mw-page-title-main">Ohio statistical areas</span> Ohio statistical areas

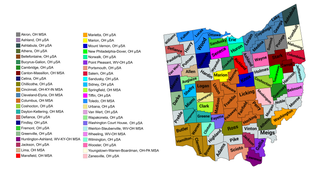
The U.S. State of Ohio currently has 55 statistical areas that have been delineated by the Office of Management and Budget (OMB). On July 21, 2023, the OMB delineated 11 combined statistical areas, 15 metropolitan statistical areas, and 29 micropolitan statistical areas in Ohio.
<span class="mw-page-title-main">New York statistical areas</span>

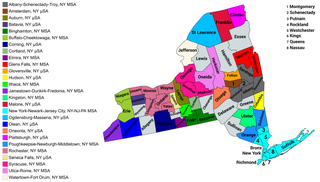
The U.S. state of New York currently has 34 statistical areas that have been delineated by the Office of Management and Budget (OMB). On March 6, 2020, the OMB delineated seven combined statistical areas, 14 metropolitan statistical areas, and 13 micropolitan statistical areas in New York.
<span class="mw-page-title-main">Wisconsin statistical areas</span> Wisconsin statistical areas

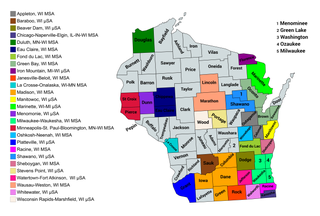
The U.S. State of Wisconsin currently has 36 statistical areas that have been delineated by the Office of Management and Budget (OMB). On March 6, 2020, the OMB delineated nine combined statistical areas, 15 metropolitan statistical areas, and 12 micropolitan statistical areas in Wisconsin.

<span class="mw-page-title-main">Montana statistical areas</span> Montana statistical areas

The U.S. State of Montana currently has seven statistical areas that have been delineated by the Office of Management and Budget (OMB). On July 21, 2023, the OMB delineated five metropolitan statistical areas and two micropolitan statistical areas in Montana.

<span class="mw-page-title-main">California statistical areas</span> California statistical areas

The U.S. State of California currently has 39 statistical areas that have been delineated by the federal Office of Management and Budget (OMB). On March 6, 2020, the OMB delineated five combined statistical areas, 26 metropolitan statistical areas, and eight micropolitan statistical areas in California.

<span class="mw-page-title-main">Alabama statistical areas</span> Alabama statistical areas

The U.S. State of Alabama currently has 37 statistical areas that have been delineated by the Office of Management and Budget (OMB). On July 21, 2023, the OMB delineated 9 combined statistical areas, 15 metropolitan statistical areas, and 13 micropolitan statistical areas in Alabama.

<span class="mw-page-title-main">Delaware statistical areas</span> Delaware statistical areas

The U.S. State of Delaware currently has four statistical areas that have been delineated by the Office of Management and Budget (OMB). On July 21, 2023, the OMB delineated one combined statistical area, two metropolitan statistical areas, and one micropolitan statistical area in Delaware.

<span class="mw-page-title-main">Iowa statistical areas</span> Iowa statistical areas

The U.S. State of Iowa currently has 30 statistical areas that have been delineated by the Office of Management and Budget (OMB). On March 6, 2020, the OMB delineated six combined statistical areas, nine metropolitan statistical areas, and 15 micropolitan statistical areas in Iowa.

<span class="mw-page-title-main">West Virginia statistical areas</span> West Virginia statistical areas

The U.S. State of West Virginia currently has 20 statistical areas that have been delineated by the Office of Management and Budget (OMB). On July 21, 2023, the OMB delineated five combined statistical areas, 10 metropolitan statistical areas, and five micropolitan statistical areas in West Virginia.

<span class="mw-page-title-main">Louisiana statistical areas</span> Louisiana statistical areas

The U.S. State of Louisiana currently has 25 statistical areas that have been delineated by the Office of Management and Budget (OMB). On July 21, 2023, the OMB delineated six combined statistical areas, ten metropolitan statistical areas, and nine micropolitan statistical areas in Louisiana.

<span class="mw-page-title-main">Maine statistical areas</span> Maine statistical areas

The U.S. State of Maine currently has five statistical areas that have been delineated by the Office of Management and Budget (OMB). On July 21, 2023, the OMB delineated one combined statistical area, three metropolitan statistical areas, and one micropolitan statistical area in Maine.

<span class="mw-page-title-main">New Mexico statistical areas</span> New Mexico statistical areas

The U.S. State of New Mexico currently has 19 statistical areas that have been delineated by the Office of Management and Budget (OMB). On July 21, 2023, the OMB delineated two combined statistical areas, four metropolitan statistical areas, and 13 micropolitan statistical areas in New Mexico.
<span class="mw-page-title-main">North Carolina statistical areas</span> North Carolina statistical areas

The U.S. State of North Carolina currently has 44 statistical areas that have been delineated by the Office of Management and Budget (OMB). On July 21, 2023, the OMB delineated 7 combined statistical areas, 16 metropolitan statistical areas, and 21 micropolitan statistical areas in North Carolina.
<span class="mw-page-title-main">Oklahoma statistical areas</span>

The U.S. State of Oklahoma currently has 26 statistical areas that have been delineated by the Office of Management and Budget (OMB). On March 6, 2020, the OMB delineated four combined statistical areas, five metropolitan statistical areas, and 17 micropolitan statistical areas in Oklahoma.

<span class="mw-page-title-main">Oregon statistical areas</span> Oregon statistical areas

The U.S. State of Oregon currently has 24 statistical areas that have been delineated by the Office of Management and Budget (OMB). On March 6, 2020, the OMB delineated four combined statistical areas, eight metropolitan statistical areas, and 12 micropolitan statistical areas in Oregon.
<span class="mw-page-title-main">South Carolina statistical areas</span> South Carolina statistical areas

The U.S. State of South Carolina currently has 20 statistical areas that have been delineated by the Office of Management and Budget (OMB). On July 21, 2023, the OMB delineated four combined statistical areas, ten metropolitan statistical areas, and six micropolitan statistical areas in South Carolina.

<span class="mw-page-title-main">South Dakota statistical areas</span> South Dakota statistical areas

The U.S. State of South Dakota currently has 14 statistical areas that have been delineated by the Office of Management and Budget (OMB). On July 21, 2023, the OMB delineated two combined statistical areas, three metropolitan statistical areas, and nine micropolitan statistical areas in South Dakota.

The Commonwealth of Puerto Rico currently has 15 statistical areas that have been delineated by the United States Office of Management and Budget (OMB). On March 6, 2020, the OMB delineated three combined statistical areas, eight metropolitan statistical areas, and four micropolitan statistical areas in Puerto Rico.

References

  1. 1 2 3 4 Revised Delineations of Metropolitan Statistical Areas, Micropolitan Statistical Areas, and Combined Statistical Areas, and Guidance on Uses of the Delineations of These Areas (July 21, 2023). "0MB BULLETIN NO. 23-01" (PDF). Office of Management and Budget . Retrieved November 5, 2023.{{cite web}}: CS1 maint: multiple names: authors list (link)
  2. 1 2 3 4 5 6 7 "2020 Standards for Delineating Core Based Statistical Areas". Office of Management and Budget. July 16, 2021. Retrieved December 15, 2021.
  3. An out-of-state area and its population are displayed in green.An area that extends into more than one state is displayed in teal. A teal population number over a black population number show the total population versus the in-state population.
  4. 1 2 3 "Annual Estimates of the Resident Population for Counties in the United States: April 1, 2010 to July 1, 2019". United States Census Bureau, Population Division. April 2020. Retrieved April 9, 2020.

47°27′00″N100°27′57″W / 47.4501°N 100.4659°W / 47.4501; -100.4659 (State of North Dakota)