South Dakota statistical areas

Last updated
An enlargeable map of the 12 core-based statistical areas in South Dakota. South Dakota CBSAs 2020.png
An enlargeable map of the 12 core-based statistical areas in South Dakota .

The U.S. State of South Dakota currently has 13 statistical areas that have been delineated by the Office of Management and Budget (OMB). On March 6, 2020, the OMB delineated one combined statistical area, three metropolitan statistical areas, and nine micropolitan statistical areas in South Dakota. [1]

Contents

Statistical areas

The Office of Management and Budget (OMB) has designated more than 1,000 statistical areas for the United States and Puerto Rico. [2] These statistical areas are important geographic delineations of population clusters used by the OMB, the United States Census Bureau, planning organizations, and federal, state, and local government entities.

The OMB defines a core-based statistical area (commonly referred to as a CBSA) as "a statistical geographic entity consisting of the county or counties (or county-equivalents) associated with at least one core [lower-alpha 1] of at least 10,000 population, plus adjacent counties having a high degree of social and economic integration with the core as measured through commuting ties with the counties containing the core." [2] The OMB further divides core-based statistical areas into metropolitan statistical areas (MSAs) that have "a population of at least 50,000" and micropolitan statistical areas (μSAs) that have "a population of at least 10,000, but less than 50,000." [2]

The OMB defines a combined statistical area (CSA) as "a geographic entity consisting of two or more adjacent core-based statistical areas with employment interchange measures [lower-alpha 2] of at least 15%." [2] The primary statistical areas (PSAs) include all combined statistical areas and any core-based statistical area that is not a constituent of a combined statistical area.


Table

The table below describes the 13 United States statistical areas and 66 counties of the State of South Dakota with the following information: [3]

  1. The combined statistical area (CSA) as designated by the OMB. [1]
  2. The CSA population according to 2019 US Census Bureau population estimates. [4]
  3. The core based statistical area (CBSA) [2] as designated by the OMB. [1]
  4. The CBSA population according to 2019 US Census Bureau population estimates [4]
  5. The county name
  6. The county population according to 2019 US Census Bureau population estimates [4]
The 13 United States statistical areas and 66 counties of the State of South Dakota

Combined Statistical Area2019 PopulationCore Based Statistical Area2019 PopulationCounty2019 Population
none Sioux Falls, SD MSA 268,232 Minnehaha County, South Dakota 193,134
Lincoln County, South Dakota 61,128
Turner County, South Dakota 8,384
McCook County, South Dakota 5,586
Rapid City-Spearfish, SD CSA 167,951Rapid City, SD MSA142,107 Pennington County, South Dakota 113,775
Meade County, South Dakota 28,332
Spearfish, SD μSA 25,844 Lawrence County, South Dakota 25,844
none Aberdeen, SD μSA 42,668 Brown County, South Dakota 38,839
Edmunds County, South Dakota 3,829
Brookings, SD μSA 35,077 Brookings County, South Dakota 35,077
Watertown, SD μSA 34,173 Codington County, South Dakota 28,009
Hamlin County, South Dakota 6,164
Mitchell, SD μSA 23,228 Davison County, South Dakota 19,775
Hanson County, South Dakota 3,453
Yankton, SD μSA 22,814 Yankton County, South Dakota 22,814
Pierre, SD μSA 20,624 Hughes County, South Dakota 17,526
Stanley County, South Dakota 3,098
Huron, SD μSA 20,466 Beadle County, South Dakota 18,453
Jerauld County, South Dakota 2,013
Sioux City, IA-NE-SD MSA 144,701
15,932
Woodbury County, Iowa 103,107
Dakota County, Nebraska 20,026
Union County, South Dakota 15,932
Dixon County, Nebraska 5,636
Vermillion, SD μSA 14,070 Clay County, South Dakota 14,070
none Oglala Lakota County, South Dakota 14,177
Lake County, South Dakota 12,797
Butte County, South Dakota 10,429
Roberts County, South Dakota 10,394
Todd County, South Dakota 10,177
Charles Mix County, South Dakota 9,292
Custer County, South Dakota 8,972
Hutchinson County, South Dakota 7,291
Grant County, South Dakota 7,052
Bon Homme County, South Dakota 6,901
Fall River County, South Dakota 6,713
Moody County, South Dakota 6,576
Spink County, South Dakota 6,376
Dewey County, South Dakota 5,892
Tripp County, South Dakota 5,441
Walworth County, South Dakota 5,435
Day County, South Dakota 5,424
Brule County, South Dakota 5,297
Kingsbury County, South Dakota 4,939
Marshall County, South Dakota 4,935
Deuel County, South Dakota 4,351
Gregory County, South Dakota 4,185
Corson County, South Dakota 4,086
Lyman County, South Dakota 3,781
Clark County, South Dakota 3,736
Bennett County, South Dakota 3,365
Jackson County, South Dakota 3,344
Hand County, South Dakota 3,191
Douglas County, South Dakota 2,921
Perkins County, South Dakota 2,865
Ziebach County, South Dakota 2,756
Aurora County, South Dakota 2,751
McPherson County, South Dakota 2,379
Sanborn County, South Dakota 2,344
Faulk County, South Dakota 2,299
Miner County, South Dakota 2,216
Potter County, South Dakota 2,153
Mellette County, South Dakota 2,061
Buffalo County, South Dakota 1,962
Haakon County, South Dakota 1,899
Sully County, South Dakota 1,391
Campbell County, South Dakota 1,376
Hyde County, South Dakota 1,301
Harding County, South Dakota 1,298
Jones County, South Dakota 904
State of South Dakota 884,660

See also

Notes

  1. The OMB defines a core as "a densely settled concentration of population, comprising an Urban Area (of 10,000 or more population) delineated by the Census Bureau, around which a core-based statistical area is delineated." [2]
  2. The OMB defines the employment interchange measure as "the sum of the percentage of workers living in the smaller entity who work in the larger entity plus the percentage of employment in the smaller entity that is accounted for by workers who reside in the larger entity." [2]

Related Research Articles

<span class="mw-page-title-main">Indiana statistical areas</span> Indiana statistical areas

The U.S. State of Indiana currently has 51 statistical areas that have been delineated by the Office of Management and Budget (OMB). On March 6, 2020, the OMB delineated ten combined statistical areas, 15 metropolitan statistical areas, and 26 micropolitan statistical areas in Indiana.

<span class="mw-page-title-main">Illinois statistical areas</span> Illinois statistical areas

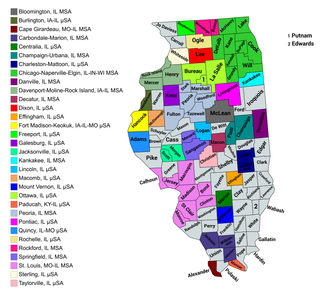
The U.S. State of Illinois currently has 43 statistical areas that have been delineated by the Office of Management and Budget (OMB). On March 6, 2020, the OMB delineated 11 combined statistical areas, 13 metropolitan statistical areas, and 19 micropolitan statistical areas in Illinois.

<span class="mw-page-title-main">Ohio statistical areas</span> Ohio statistical areas

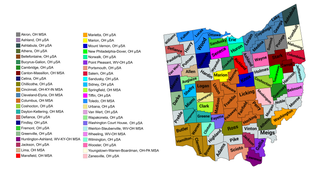
The U.S. State of Ohio currently has 57 statistical areas that have been delineated by the Office of Management and Budget (OMB). On March 6, 2020, the OMB delineated 11 combined statistical areas, 14 metropolitan statistical areas, and 32 micropolitan statistical areas in Ohio.

<span class="mw-page-title-main">New York statistical areas</span> New York statistical areas

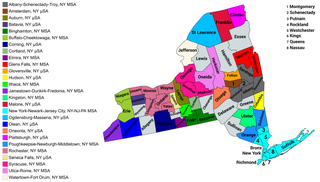
The U.S. State of New York currently has 34 statistical areas that have been delineated by the Office of Management and Budget (OMB). On March 6, 2020, the OMB delineated seven combined statistical areas, 14 metropolitan statistical areas, and 13 micropolitan statistical areas in New York.

<span class="mw-page-title-main">Wisconsin statistical areas</span> Wisconsin statistical areas

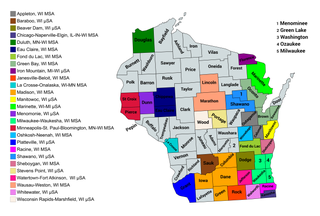
The U.S. State of Wisconsin currently has 36 statistical areas that have been delineated by the Office of Management and Budget (OMB). On March 6, 2020, the OMB delineated nine combined statistical areas, 15 metropolitan statistical areas, and 12 micropolitan statistical areas in Wisconsin.

<span class="mw-page-title-main">Texas statistical areas</span> Texas statistical areas

The U.S. State of Texas currently has 84 statistical areas that have been delineated by the Office of Management and Budget (OMB). On March 6, 2020, the OMB delineated 13 combined statistical areas, 25 metropolitan statistical areas, and 46 micropolitan statistical areas in Texas.

<span class="mw-page-title-main">Montana statistical areas</span> Montana statistical areas

The U.S. State of Montana currently has seven statistical areas that have been delineated by the Office of Management and Budget (OMB). On March 6, 2020, the OMB delineated three metropolitan statistical areas and four micropolitan statistical areas in Montana.

<span class="mw-page-title-main">California statistical areas</span> California statistical areas

The U.S. State of California currently has 39 statistical areas that have been delineated by the Office of Management and Budget (OMB). On March 6, 2020, the OMB delineated five combined statistical areas, 26 metropolitan statistical areas, and eight micropolitan statistical areas in California.

<span class="mw-page-title-main">Idaho statistical areas</span> Idaho statistical areas

The U.S. State of Idaho currently has 20 statistical areas that have been delineated by the Office of Management and Budget (OMB). On March 6, 2020, the OMB delineated four combined statistical areas, seven metropolitan statistical areas, and nine micropolitan statistical areas in Idaho.

<span class="mw-page-title-main">West Virginia statistical areas</span> West Virginia statistical areas

The U.S. State of West Virginia currently has 22 statistical areas that have been delineated by the Office of Management and Budget (OMB). On March 6, 2020, the OMB delineated five combined statistical areas, 11 metropolitan statistical areas, and six micropolitan statistical areas in West Virginia.

<span class="mw-page-title-main">Missouri statistical areas</span> Missouri statistical areas

The U.S. State of Missouri currently has 34 statistical areas that have been delineated by the Office of Management and Budget (OMB). On March 6, 2020, the OMB delineated seven combined statistical areas, eight metropolitan statistical areas, and 19 micropolitan statistical areas in Missouri.

<span class="mw-page-title-main">Nebraska statistical areas</span> Nebraska statistical areas

The U.S. State of Nebraska currently has 15 statistical areas that have been delineated by the Office of Management and Budget (OMB). On March 6, 2020, the OMB delineated two combined statistical areas, four metropolitan statistical areas, and nine micropolitan statistical areas in Nebraska.

<span class="mw-page-title-main">New Hampshire statistical areas</span> New Hampshire statistical areas

The U.S. State of New Hampshire currently has eight statistical areas that have been delineated by the Office of Management and Budget (OMB). On March 6, 2020, the OMB delineated one combined statistical area, two metropolitan statistical areas, and five micropolitan statistical areas in New Hampshire.

<span class="mw-page-title-main">New Mexico statistical areas</span> New Mexico statistical areas

The U.S. State of New Mexico currently has 22 statistical areas that have been delineated by the Office of Management and Budget (OMB). On March 6, 2020, the OMB delineated three combined statistical areas, four metropolitan statistical areas, and 15 micropolitan statistical areas in New Mexico.

<span class="mw-page-title-main">North Carolina statistical areas</span> North Carolina statistical areas

The U.S. State of North Carolina currently has 49 statistical areas that have been delineated by the Office of Management and Budget (OMB). On March 6, 2020, the OMB delineated ten combined statistical areas, 17 metropolitan statistical areas, and 22 micropolitan statistical areas in North Carolina.

<span class="mw-page-title-main">North Dakota statistical areas</span> North Dakota statistical areas

The U.S. State of North Dakota currently has nine statistical areas that have been delineated by the Office of Management and Budget (OMB). On March 6, 2020, the OMB delineated one combined statistical area, three metropolitan statistical areas, and five micropolitan statistical areas in North Dakota.

<span class="mw-page-title-main">Oklahoma statistical areas</span>

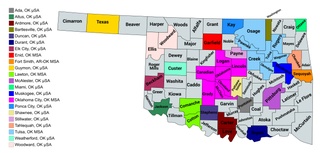
The U.S. State of Oklahoma currently has 26 statistical areas that have been delineated by the Office of Management and Budget (OMB). On March 6, 2020, the OMB delineated four combined statistical areas, five metropolitan statistical areas, and 17 micropolitan statistical areas in Oklahoma.

<span class="mw-page-title-main">Oregon statistical areas</span> Oregon statistical areas

The U.S. State of Oregon currently has 24 statistical areas that have been delineated by the Office of Management and Budget (OMB). On March 6, 2020, the OMB delineated four combined statistical areas, eight metropolitan statistical areas, and 12 micropolitan statistical areas in Oregon.

<span class="mw-page-title-main">South Carolina statistical areas</span> South Carolina statistical areas

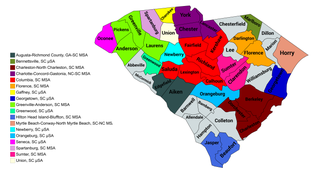
The U.S. State of South Carolina currently has 22 statistical areas that have been delineated by the Office of Management and Budget (OMB). On March 6, 2020, the OMB delineated four combined statistical areas, ten metropolitan statistical areas, and eight micropolitan statistical areas in South Carolina.

The Commonwealth of Puerto Rico currently has 15 statistical areas that have been delineated by the United States Office of Management and Budget (OMB). On March 6, 2020, the OMB delineated three combined statistical areas, eight metropolitan statistical areas, and four micropolitan statistical areas in Puerto Rico.

References

  1. 1 2 3 4 Revised Delineations of Metropolitan Statistical Areas, Micropolitan Statistical Areas, and Combined Statistical Areas, and Guidance on Uses of the Delineations of These Areas (March 6, 2020). "0MB BULLETIN NO. 20-01" (PDF). Office of Management and Budget . Retrieved December 15, 2021.{{cite web}}: CS1 maint: multiple names: authors list (link)
  2. 1 2 3 4 5 6 7 "2020 Standards for Delineating Core Based Statistical Areas". Office of Management and Budget. July 16, 2021. Retrieved December 15, 2021.
  3. An out-of-state area and its population are displayed in green.An area that extends into more than one state is displayed in teal. A teal population number over a black population number show the total population versus the in-state population.
  4. 1 2 3 "Annual Estimates of the Resident Population for Counties in the United States: April 1, 2010 to July 1, 2019". United States Census Bureau, Population Division. April 2020. Retrieved April 9, 2020.

Coordinates: 44°26′39″N100°13′35″W / 44.4443°N 100.2263°W / 44.4443; -100.2263 (State of South Dakota)