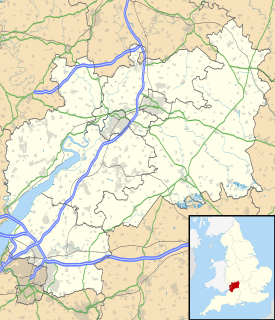
The 2008 Stroud Council election took place on 1 May 2008 to elect members of Stroud District Council in Gloucestershire, England. One third of the council was up for election and the Conservative party stayed in overall control of the council. [1]
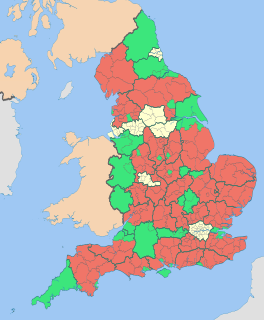
Non-metropolitan districts, or colloquially "shire districts", are a type of local government district in England. As created, they are sub-divisions of non-metropolitan counties in a two-tier arrangement.
Gloucestershire is a county in South West England. The county comprises part of the Cotswold Hills, part of the flat fertile valley of the River Severn, and the entire Forest of Dean.
England is a country that is part of the United Kingdom. It shares land borders with Wales to the west and Scotland to the north-northwest. The Irish Sea lies west of England and the Celtic Sea lies to the southwest. England is separated from continental Europe by the North Sea to the east and the English Channel to the south. The country covers five-eighths of the island of Great Britain, which lies in the North Atlantic, and includes over 100 smaller islands, such as the Isles of Scilly and the Isle of Wight.
After the election, the composition of the council was
The Conservative Party, officially the Conservative and Unionist Party, is a centre-right political party in the United Kingdom. Presently led by Theresa May, it has been the governing party since 2010. It presently has 314 Members of Parliament in the House of Commons, 249 members of the House of Lords, and 18 members of the European Parliament. It also has 31 Members of the Scottish Parliament, 12 members of the Welsh Assembly, eight members of the London Assembly and 9,008 local councillors. One of the major parties of UK politics, it has formed the government on 45 occasions, more than any other party.
The Labour Party is a centre-left political party in the United Kingdom which has been described as an alliance of social democrats, democratic socialists and trade unionists. The party's platform emphasises greater state intervention, social justice and strengthening workers' rights. Labour is a full member of the Party of European Socialists and Progressive Alliance, and holds observer status in the Socialist International. As of 2017, the party was considered the "largest party in Western Europe" in terms of party membership, with more than half a million members.
The Green Party of England and Wales is a green, left-wing political party in England and Wales. Headquartered in London, since September 2018, its Co-Leaders are Siân Berry and Jonathan Bartley. The Green Party has one Member of Parliament in the House of Commons, one representative in the House of Lords, and three Members of the European Parliament. It has various councillors in UK local government and two members of the London Assembly.
Before the election the council had 31 Conservative, 9 Labour, 5 Green, 4 Liberal Democrat and 2 independents. [3] 61 candidates stood for the 17 seats that were being contested, with the Green party contesting every seat for the first time. [3] Councillors standing down at the election included Conservative Sue Fellows and the Labour party's Hilary Fowles and Mattie Ross. [3]
The Liberal Democrats are a liberal, centrist political party in the United Kingdom. They presently have 11 Members of Parliament in the House of Commons, 96 members of the House of Lords, and one member of the European Parliament. They also have five Members of the Scottish Parliament and a member each in the Welsh Assembly and London Assembly. The party reached the height of its influence in the early 2010s, forming a junior partner in a coalition government from 2010 to 2015. It is presently led by Vince Cable.
A Councillor is a member of a local government council.
The results saw the Conservatives stay in control with 31 seats, after both gaining and losing 2 seats, [4] while increasing their vote share to 51%. [5] The Conservatives gained the seats of Dursley and Stonehouse from Labour, after the sitting Labour councillors had stood down, reducing Labour to 7 seats. [6] However the Conservatives also lost Nailsworth by 28 votes to the Greens and Wotton-under-Edge by 25 votes to the Liberal Democrats. [6] This meant the Greens went up to 6 seats and the Liberal Democrats up to 5 seats, while there remained 2 independents who had not defended seats in the election. [6] Turnout in the election varied from a high of 50.03% in Painswick to a low of 33% in Cainscross. [6]
Dursley is a market town and civil parish in southern Gloucestershire, England, situated almost equidistantly between the cities of Bristol and Gloucester. It is under the northeast flank of Stinchcombe Hill, and about 3 3⁄4 miles (6.0 km) southeast of the River Severn. The town is adjacent to Cam which, though a village, is a slightly larger community in its own right.
Stonehouse is a town in the Stroud District of Gloucestershire in southwestern England.
Nailsworth is a town and civil parish in Gloucestershire, England, lying in one of the Stroud Valleys in the Cotswolds, on the A46 road, 3.5 miles (5.6 km) south of Stroud and about 25 miles (40 km) north of Bath. The parish had a population of 5,794 at the 2011 census.
The local Labour Member of Parliament David Drew blamed the defeats for Labour on "general disillusionment with the Government" and the issues of government assistance after the 2007 floods and the abolition of the 10 pence income tax rate. [7]
David Elliott Drew is a British Labour Co-operative politician who is the Member of Parliament (MP) for Stroud from 1997 to 2010, and regained his seat on 9 June 2017.
A series of serious floods occurred in parts of the United Kingdom during the summer of 2007. The worst of the flooding occurred across Scotland on 14 June; East Yorkshire and The Midlands on 15 June; Yorkshire, The Midlands, Gloucestershire, Herefordshire and Worcestershire on 25 June; and Gloucestershire, Herefordshire, Worcestershire, Oxfordshire, Berkshire and South Wales on 28 July 2007.
An income tax is a tax imposed on individuals or entities (taxpayers) that varies with respective income or profits. Income tax generally is computed as the product of a tax rate times taxable income. Taxation rates may vary by type or characteristics of the taxpayer.
Party | Seats | Gains | Losses | Net gain/loss | Seats % | Votes % | Votes | +/− | |
---|---|---|---|---|---|---|---|---|---|
Conservative | 12 | 2 | 2 | 0 | 70.6 | 51.2 | 13,231 | +10.8% | |
Labour | 2 | 0 | 2 | -2 | 11.8 | 17.4 | 4,491 | -5.7% | |
Liberal Democrat | 2 | 1 | 0 | +1 | 11.8 | 12.2 | 3,142 | -1.3% | |
Green | 1 | 1 | 0 | +1 | 5.9 | 17.8 | 4,595 | -1.1% | |
UKIP | 0 | 0 | 0 | 0 | 0 | 1.2 | 300 | -0.5% | |
BNP | 0 | 0 | 0 | 0 | 0 | 0.3 | 67 | +0.3% |
Party | Candidate | Votes | % | ± | |
---|---|---|---|---|---|
Conservative | Stephen Glanfield | 452 | 54.3 | -1.7 | |
Green | Jennifer Whiskerd | 151 | 18.1 | +2.6 | |
Labour | Jo Smith | 131 | 15.7 | +0.8 | |
Liberal Democrat | Adrian Walker-Smith | 98 | 11.8 | -1.8 | |
Majority | 301 | 36.2 | -4.2 | ||
Turnout | 832 | 49.4 | |||
Conservative hold | Swing |
Party | Candidate | Votes | % | ± | |
---|---|---|---|---|---|
Conservative | Tim Archer | 861 | 67.2 | -2.7 | |
Labour | Geoffrey Wheeler | 295 | 23.0 | -7.1 | |
Green | Chris Keppie | 126 | 9.8 | +9.8 | |
Majority | 566 | 44.1 | +4.4 | ||
Turnout | 1,282 | 39.0 | -0.9 | ||
Conservative hold | Swing |
Party | Candidate | Votes | % | ± | |
---|---|---|---|---|---|
Labour | Tom Williams | 757 | 42.2 | -7.1 | |
Conservative | Norma Rodman | 648 | 36.2 | +1.4 | |
Green | Helen Royall | 195 | 10.9 | -5.0 | |
Liberal Democrat | Sylvia Bridgland | 192 | 10.7 | +10.7 | |
Majority | 109 | 6.1 | -8.4 | ||
Turnout | 1,792 | 33.3 | -3.2 | ||
Labour hold | Swing |
Party | Candidate | Votes | % | ± | |
---|---|---|---|---|---|
Conservative | Debbie Young | 1,217 | 56.2 | +0.9 | |
Green | Carolyn Billingsley | 633 | 29.2 | +4.8 | |
Labour | Malcolm Perry | 195 | 9.0 | -3.4 | |
UKIP | Leslie Banstead | 121 | 5.6 | -2.2 | |
Majority | 584 | 27.0 | -3.9 | ||
Turnout | 2,166 | 43.2 | +2.8 | ||
Conservative hold | Swing |
Party | Candidate | Votes | % | ± | |
---|---|---|---|---|---|
Conservative | Alex Stennett | 647 | 34.4 | -0.1 | |
Liberal Democrat | Brian Marsh | 608 | 32.3 | +0.5 | |
Labour | Daryl Matthews | 531 | 28.2 | -5.5 | |
Green | Gillian Stott | 97 | 5.2 | +5.2 | |
Majority | 39 | 2.1 | +1.4 | ||
Turnout | 1,883 | 39.0 | -1.9 | ||
Conservative gain from Labour | Swing | ||||
Party | Candidate | Votes | % | ± | |
---|---|---|---|---|---|
Labour | Ken Stephens | 288 | 44.5 | +3.4 | |
Conservative | Ian Robinson | 277 | 42.8 | +3.4 | |
Green | Gerald Hartley | 82 | 12.7 | +2.1 | |
Majority | 11 | 1.7 | +0.0 | ||
Turnout | 647 | 45.9 | |||
Labour hold | Swing |
Party | Candidate | Votes | % | ± | |
---|---|---|---|---|---|
Conservative | Len Tomlins | 875 | 69.3 | +0.9 | |
Labour | Miranda Williams | 227 | 18.0 | +3.4 | |
Green | Sally Pickering | 160 | 12.7 | +12.7 | |
Majority | 648 | 51.3 | -0.1 | ||
Turnout | 1,262 | 33.8 | -1.8 | ||
Conservative hold | Swing |
Party | Candidate | Votes | % | ± | |
---|---|---|---|---|---|
Liberal Democrat | Paul Hemming | 309 | 50.3 | -0.7 | |
Conservative | Michael Howard | 187 | 30.5 | -12.1 | |
Green | Sue Fleming | 118 | 19.2 | +19.2 | |
Majority | 122 | 19.9 | +11.5 | ||
Turnout | 614 | 40.3 | |||
Liberal Democrat hold | Swing |
Party | Candidate | Votes | % | ± | |
---|---|---|---|---|---|
Conservative | Joe Forbes | 1,112 | 71.2 | +8.0 | |
Green | Marie Gwynn | 275 | 17.6 | +6.3 | |
Labour | Joan Moore | 175 | 11.2 | -1.0 | |
Majority | 837 | 53.6 | +3.7 | ||
Turnout | 1,562 | 44.6 | -4.5 | ||
Conservative hold | Swing |
Party | Candidate | Votes | % | ± | |
---|---|---|---|---|---|
Green | Fi MacMillan | 1,028 | 43.1 | +5.2 | |
Conservative | Dorcas Binns | 1,000 | 41.9 | +3.5 | |
Labour | Sally Thorpe | 229 | 9.6 | -3.7 | |
BNP | Alan Lomas | 67 | 2.8 | +2.8 | |
UKIP | Maureen Upchurch | 61 | 2.6 | -2.7 | |
Majority | 28 | 1.2 | |||
Turnout | 2,385 | 46.4 | +2.6 | ||
Green gain from Conservative | Swing | ||||
Party | Candidate | Votes | % | ± | |
---|---|---|---|---|---|
Conservative | Barbara Tait | 1,228 | 69.0 | +1.9 | |
Green | Elinor Croxall | 371 | 20.8 | -1.5 | |
Labour | David Heyes | 181 | 10.2 | -0.5 | |
Majority | 857 | 48.1 | +3.3 | ||
Turnout | 1,780 | 50.0 | -0.3 | ||
Conservative hold | Swing |
Party | Candidate | Votes | % | ± | |
---|---|---|---|---|---|
Conservative | Nigel Cooper | 516 | 32.1 | +1.7 | |
Liberal Democrat | Andrew Fisk | 465 | 29.0 | -1.8 | |
Green | Phil Blomberg | 446 | 27.8 | +1.7 | |
Labour | John Appleton | 178 | 11.1 | -1.6 | |
Majority | 51 | 3.2 | |||
Turnout | 1,605 | 46.4 | +1.7 | ||
Conservative hold | Swing |
Party | Candidate | Votes | % | ± | |
---|---|---|---|---|---|
Conservative | Norman-Leonard Smith | 961 | 60.6 | +3.1 | |
Liberal Democrat | John Howe | 306 | 19.3 | -7.2 | |
Labour | John Greenwood | 206 | 13.0 | -1.9 | |
Green | Annie Finlay-Trotter | 114 | 7.2 | +7.2 | |
Majority | 655 | 41.3 | +10.3 | ||
Turnout | 1,587 | 42.9 | +0.0 | ||
Conservative hold | Swing |
Party | Candidate | Votes | % | ± | |
---|---|---|---|---|---|
Conservative | Phil Bevan | 843 | 42.1 | +5.1 | |
Labour | Gary Powell | 806 | 40.2 | -1.1 | |
Green | Clare Sheridan | 237 | 11.8 | -2.1 | |
UKIP | Adrian Blake | 118 | 5.9 | -1.8 | |
Majority | 37 | 1.8 | |||
Turnout | 2,004 | 34.1 | -1.5 | ||
Conservative gain from Labour | Swing | ||||
Party | Candidate | Votes | % | ± | |
---|---|---|---|---|---|
Conservative | Ray Apperley | 718 | 52.3 | -1.4 | |
Labour | Lesley Williams | 316 | 23.0 | +3.3 | |
Green | Tony Mcnulty | 190 | 13.8 | +0.9 | |
Liberal Democrat | Gavin Owen | 150 | 10.9 | -2.8 | |
Majority | 402 | 29.3 | -4.8 | ||
Turnout | 1,374 | 41.2 | -1.8 | ||
Conservative hold | Swing |
Party | Candidate | Votes | % | ± | |
---|---|---|---|---|---|
Conservative | Keith Pearson | 710 | 78.9 | +0.4 | |
Green | Peter Adams | 114 | 12.7 | +12.7 | |
Labour | Ela Pathak-Sen | 76 | 8.4 | -13.1 | |
Majority | 596 | 66.2 | +9.3 | ||
Turnout | 900 | 48.9 | +1.3 | ||
Conservative hold | Swing |
Party | Candidate | Votes | % | ± | |
---|---|---|---|---|---|
Liberal Democrat | June Cordwell | 1,014 | 45.0 | -7.2 | |
Conservative | John Gowers | 979 | 43.5 | +18.4 | |
Green | Martin Harvey | 258 | 11.5 | -5.5 | |
Majority | 35 | 1.6 | -25.5 | ||
Turnout | 2,251 | 45.0 | -0.9 | ||
Liberal Democrat gain from Conservative | Swing | ||||
The 1998 Solihull Metropolitan Borough Council election took place on 7 May 1998 to elect members of Solihull Metropolitan Borough Council in the West Midlands, England. One third of the council was up for election and the council stayed under no overall control.
Hertfordshire County Council in England is elected every four years. Since the last boundary changes, that took effect for the 2001 election, 77 councillors are elected for single member districts.
The 2008 Solihull Metropolitan Borough Council election took place on 1 May 2008 to elect members of Solihull Metropolitan Borough Council in the West Midlands, England. One third of the council was up for election and the Conservative party gained overall control of the council from no overall control.
The 2008 Wyre Forest District Council election took place on 1 May 2008 to elect members of Wyre Forest District Council in Worcestershire, England. One third of the council was up for election and the Conservative party gained overall control of the council from no overall control.
The 2006 Rushmoor Council election took place on 4 May 2006 to elect members of Rushmoor Borough Council in Hampshire, England. One third of the council was up for election and the Conservative party stayed in overall control of the council.
The 2008 Cheltenham Council election took place on 1 May 2008 to elect members of Cheltenham Borough Council in Gloucestershire, England. Half of the council was up for election and the council stayed under no overall control.
The 2006 Solihull Metropolitan Borough Council election took place on 4 May 2006 to elect members of Solihull Metropolitan Borough Council in the West Midlands, England. One third of the council was up for election and the Conservative party stayed in overall control of the council.
The 2008 Sunderland Council election took place on 1 May 2008 to elect members of Sunderland Metropolitan Borough Council in Tyne and Wear, England. One third of the council was up for election and the Labour party stayed in overall control of the council.
The 2010 Sunderland Council election took place on 6 May 2010 to elect members of Sunderland Metropolitan Borough Council in Tyne and Wear, England. One third of the council was up for election and the Labour party stayed in overall control of the council. The election took place on the same day as the 2010 General Election.
The 1998 Stroud Council election took place on 7 May 1998 to elect members of Stroud District Council in Gloucestershire, England. One third of the council was up for election and the council stayed under no overall control.
The 1999 Stroud Council election took place on 6 May 1999 to elect members of Stroud District Council in Gloucestershire, England. One third of the council was up for election and the council stayed under no overall control.
The 2000 Stroud Council election took place on 4 May 2000 to elect members of Stroud District Council in Gloucestershire, England. One third of the council was up for election and the council stayed under no overall control.
The 2006 Stroud Council election took place on 4 May 2006 to elect members of Stroud District Council in Gloucestershire, England. One third of the council was up for election and the Conservative party stayed in overall control of the council.
The 2007 Stroud Council election took place on 3 May 2007 to elect members of Stroud District Council in Gloucestershire, England. One third of the council was up for election and the Conservative party stayed in overall control of the council.
The 2010 Stroud Council election took place on 6 May 2010 to elect members of Stroud District Council in Gloucestershire, England. One third of the council was up for election and the Conservative party stayed in overall control of the council.
The 2008 Harrogate Council election took place on 1 May 2008 to elect members of Harrogate Borough Council in North Yorkshire, England. One third of the council was up for election and the council stayed under no overall control.
The 2008 Sandwell Metropolitan Borough Council election took place on 1 May 2008 to elect members of Sandwell Metropolitan Borough Council in the West Midlands, England. One third of the council was up for election and the Labour party stayed in overall control of the council.
The elections to South Norfolk District Council were held on Thursday 5 May 2011 along with various other local elections around England, elections to the Scottish Parliament, National Assembly of Wales and Northern Ireland Assembly, and a referendum on whether to adopt the Alternative Vote electoral system for elections to the House of Commons. All 46 council seats were up for election. The previous council was controlled by the Conservatives, with the Liberal Democrats being the only opposition.
The 2011 Wealden District Council election took place on 5 May 2011 to elect members of Wealden District Council in East Sussex, England. The whole council was up for election and the Conservative party stayed in overall control of the council.
The 2007 Colchester Borough Council election took place on 3 May 2007 to elect members of Colchester Borough Council in Essex, England. One third of the council was up for election and the council stayed under no overall control.