The 2003 Swale Borough Council election took place on 1 May 2003 to elect members of Swale Borough Council in Kent, England. One third of the council was up for election and the Conservative party stayed in overall control of the council. [1]
Swale is a local government district with borough status in Kent, England and is bounded by Medway to the west, Canterbury to the east, Ashford to the south and Maidstone to the south west. Its council is based in Sittingbourne. The district is named after the narrow channel called The Swale, that separates the mainland of Kent from the Isle of Sheppey, and which occupies the central part of the district.
Borough status in the United Kingdom is granted by royal charter to local government districts in England, Wales and Northern Ireland. The status is purely honorary, and does not give any additional powers to the council or inhabitants of the district. In Scotland, similarly chartered communities were known as royal burghs, although the status is no longer granted.
Kent is a county in South East England and one of the home counties. It borders Greater London to the north west, Surrey to the west and East Sussex to the south west. The county also shares borders with Essex along the estuary of the River Thames, and with the French department of Pas-de-Calais through the Channel Tunnel. The county town is Maidstone.
After the election, the composition of the council was
Party | Seats | Gains | Losses | Net gain/loss | Seats % | Votes % | Votes | +/− | |
---|---|---|---|---|---|---|---|---|---|
Conservative | 9 | 0 | 0 | 0 | 60.0 | 44.7 | 7,153 | +1.1% | |
Labour | 3 | 1 | 0 | +1 | 20.0 | 26.5 | 4,245 | -6.0% | |
Liberal Democrat | 3 | 0 | 1 | -1 | 20.0 | 25.3 | 4,043 | +3.1% | |
Rock 'n' Roll Loony | 0 | 0 | 0 | 0 | 0 | 3.4 | 541 | +2.2% | |
Green | 0 | 0 | 0 | 0 | 0 | 0.1 | 22 | +0.1% |
Party | Candidate | Votes | % | ± | |
---|---|---|---|---|---|
Liberal Democrat | Brian Woodland | 376 | 64.2 | +19.1 | |
Conservative | Roger Hoare | 180 | 30.7 | -11.6 | |
Labour | Anthony Winckless | 30 | 5.1 | -7.5 | |
Majority | 196 | 33.4 | +30.7 | ||
Turnout | 586 | 33.7 | +1.8 | ||
Liberal Democrat hold | Swing |
Party | Candidate | Votes | % | ± | |
---|---|---|---|---|---|
Conservative | George Bobbin | 926 | 69.8 | ||
Labour | Valerie Rowe | 225 | 17.0 | ||
Liberal Democrat | June Hammond | 176 | 13.3 | ||
Majority | 701 | 52.8 | |||
Turnout | 1,327 | 33.7 | +0.7 | ||
Conservative hold | Swing |
Party | Candidate | Votes | % | ± | |
---|---|---|---|---|---|
Liberal Democrat | David Manning | 515 | 52.5 | ||
Conservative | Benjamin Stokes | 303 | 30.9 | ||
Labour | Jeane Holmes | 163 | 16.6 | ||
Majority | 212 | 21.6 | |||
Turnout | 981 | 25.4 | -2.7 | ||
Liberal Democrat hold | Swing |
Party | Candidate | Votes | % | ± | |
---|---|---|---|---|---|
Conservative | John Wright | 930 | 65.5 | ||
Liberal Democrat | Anne Jenkins | 256 | 18.0 | ||
Labour | Gail Martin | 233 | 16.4 | ||
Majority | 674 | 47.5 | |||
Turnout | 1,419 | 35.0 | +0.7 | ||
Conservative hold | Swing |
Party | Candidate | Votes | % | ± | |
---|---|---|---|---|---|
Conservative | Christopher Boden | 303 | 58.6 | -1.0 | |
Labour | Angela Walder | 131 | 25.3 | +4.4 | |
Liberal Democrat | Andrew Brown | 43 | 8.3 | -2.6 | |
Rock 'n' Roll Loony | James Mumford | 30 | 7.7 | -0.9 | |
Majority | 172 | 33.3 | -5.4 | ||
Turnout | 517 | 26.2 | -2.7 | ||
Conservative hold | Swing |
Party | Candidate | Votes | % | ± | |
---|---|---|---|---|---|
Labour | Fiona Gowdy | 489 | 48.9 | ||
Liberal Democrat | Mark Baldock | 338 | 33.8 | ||
Conservative | Anne Jack | 141 | 14.1 | ||
Rock 'n' Roll Loony | Jackie Davidson | 31 | 3.1 | ||
Majority | 151 | 15.1 | |||
Turnout | 999 | 30.0 | -2.7 | ||
Labour gain from Liberal Democrat | Swing | ||||
Party | Candidate | Votes | % | ± | |
---|---|---|---|---|---|
Conservative | Adrian Crowther | 533 | 35.3 | ||
Liberal Democrat | Anna Groves | 463 | 30.7 | ||
Labour | Kedar Prasad | 428 | 28.4 | ||
Rock 'n' Roll Loony | Michael Young | 84 | 5.6 | ||
Majority | 70 | 4.6 | |||
Turnout | 1,508 | 28.5 | -4.5 | ||
Conservative hold | Swing |
Party | Candidate | Votes | % | ± | |
---|---|---|---|---|---|
Conservative | Martin Goodhew | 665 | 45.5 | ||
Labour | Libby Tucker | 408 | 27.9 | ||
Rock 'n' Roll Loony | Christopher Driver | 257 | 17.6 | ||
Liberal Democrat | John Ellis | 130 | 8.9 | ||
Majority | 257 | 17.6 | |||
Turnout | 1,460 | 28.5 | -4.1 | ||
Conservative hold | Swing |
Party | Candidate | Votes | % | ± | |
---|---|---|---|---|---|
Labour | Mary Ronan | 291 | 43.0 | ||
Conservative | Robin Harris | 233 | 34.4 | ||
Liberal Democrat | Colin Howe | 153 | 22.6 | ||
Majority | 58 | 8.6 | |||
Turnout | 677 | 20.9 | -3.5 | ||
Labour hold | Swing |
Party | Candidate | Votes | % | ± | |
---|---|---|---|---|---|
Labour | Stephen Worrall | 520 | 63.3 | ||
Conservative | Daphne Wyatt | 151 | 18.4 | ||
Liberal Democrat | Geoffrey Partis | 80 | 9.7 | ||
Rock 'n' Roll Loony | Christine Wellard | 70 | 8.5 | ||
Majority | 369 | 44.9 | |||
Turnout | 821 | 21.9 | -3.7 | ||
Labour hold | Swing |
Party | Candidate | Votes | % | ± | |
---|---|---|---|---|---|
Conservative | Christine Coles | 508 | 45.4 | ||
Labour | John Crouch | 403 | 36.0 | ||
Liberal Democrat | Christine Martin | 139 | 12.4 | ||
Rock 'n' Roll Loony | Alma Driver | 69 | 6.2 | ||
Majority | 105 | 9.4 | |||
Turnout | 1,119 | 21.8 | -2.0 | ||
Conservative hold | Swing |
Party | Candidate | Votes | % | ± | |
---|---|---|---|---|---|
Liberal Democrat | Stuart Davidson | 384 | 38.0 | ||
Conservative | Derek Carnell | 350 | 34.7 | ||
Labour | Edward Norton | 254 | 25.1 | ||
Green | Sharon Monk | 22 | 2.2 | ||
Majority | 34 | 3.4 | |||
Turnout | 1,010 | 30.6 | -4.6 | ||
Liberal Democrat hold | Swing |
Party | Candidate | Votes | % | ± | |
---|---|---|---|---|---|
Conservative | Richard Barnicott | 579 | 48.7 | ||
Labour | Kenneth Rowles | 428 | 36.0 | ||
Liberal Democrat | Robert Baxtor | 181 | 15.2 | ||
Majority | 151 | 12.7 | |||
Turnout | 1,188 | 31.7 | +2.4 | ||
Conservative hold | Swing |
Party | Candidate | Votes | % | ± | |
---|---|---|---|---|---|
Conservative | Donald Jordan | 542 | 76.1 | +4.1 | |
Liberal Democrat | David Banks | 87 | 12.2 | -2.3 | |
Labour | Kay Murphy | 83 | 11.7 | -1.7 | |
Majority | 455 | 63.9 | +6.4 | ||
Turnout | 712 | 37.8 | -1.3 | ||
Conservative hold | Swing |
Party | Candidate | Votes | % | ± | |
---|---|---|---|---|---|
Conservative | Jean Willicombe | 809 | 47.9 | ||
Liberal Democrat | Ann McLean | 722 | 42.7 | ||
Labour | Andrew Cooper | 159 | 9.4 | ||
Majority | 87 | 5.1 | |||
Turnout | 1,690 | 43.3 | -3.8 | ||
Conservative hold | Swing |
The 2008 St Helens Metropolitan Borough Council election took place on 1 May 2008 to elect members of St Helens Metropolitan Borough Council in Merseyside, England. One third of the council was up for election and the council stayed under no overall control.
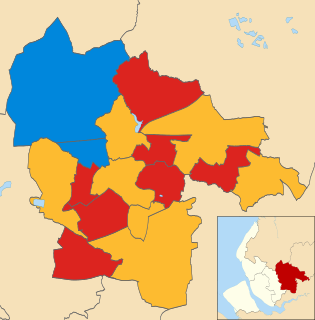
The 2007 St Helens Metropolitan Borough Council election took place on 3 May 2007 to elect members of St Helens Metropolitan Borough Council in Merseyside, England. One third of the council was up for election and the council stayed under no overall control.
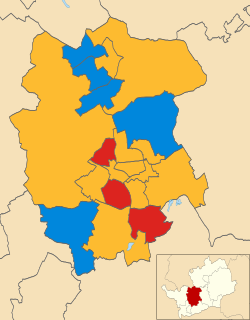
The 2003 St Albans City and District Council election took place on 1 May 2003 to elect members of St Albans District Council in Hertfordshire, England. One third of the council was up for election and the council stayed under no overall control.
The 2003 Havant Borough Council election took place on 1 May 2003 to elect members of Havant Borough Council in Hampshire, England. One third of the council was up for election and the Conservative party stayed in overall control of the council.
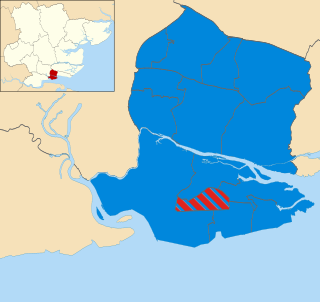
The 2003 Castle Point Borough Council election took place on 1 May 2003 to elect members of Castle Point Borough Council in Essex, England. The whole council was up for election after boundary changes increased the number of seats by 2. The Conservative party gained overall control of the council from the Labour party.
The 2008 Castle Point Borough Council election took place on 1 May 2008 to elect members of Castle Point Borough Council in Essex, England. One third of the council was up for election and the Conservative party stayed in overall control of the council.
The 2006 Brent London Borough Council election took place on 4 May 2006 to elect members of Brent London Borough Council in London, England. The whole council was up for election and the Labour party lost overall control of the council to no overall control.
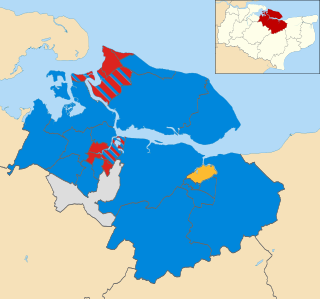
Swale Borough Council in Kent, England is elected every four years. Until 2011 one third of the council was elected every year, followed by one year without election. Since the last boundary changes in 2002, 47 councillors have been elected from 25 wards.
The 1998 Swale Borough Council election took place on 7 May 1998 to elect members of Swale Borough Council in Kent, England. One third of the council was up for election and the council remained under no overall control.
The 1999 Swale Borough Council election took place on 6 May 1999 to elect members of Swale Borough Council in Kent, England. One third of the council was up for election and the council remained under no overall control.
The 2000 Swale Borough Council election took place on 4 May 2000 to elect members of Swale Borough Council in Kent, England. One third of the council was up for election and the council remained under no overall control.
The 2002 Swale Borough Council election took place on 2 May 2002 to elect members of Swale Borough Council in Kent, England. The whole council was up for election with boundary changes since the last election in 2000 reducing the number of seats by two. The Conservative party gained overall control of the council from no overall control.
The 2004 Swale Borough Council election took place on 10 June 2004 to elect members of Swale Borough Council in Kent, England. One third of the council was up for election and the Conservative party stayed in overall control of the council.
The 2006 Swale Borough Council election took place on 4 May 2006 to elect members of Swale Borough Council in Kent, England. One third of the council was up for election and the Conservative party stayed in overall control of the council.
The 2007 Swale Borough Council election took place on 3 May 2007 to elect members of Swale Borough Council in Kent, England. One third of the council was up for election and the Conservative party stayed in overall control of the council.
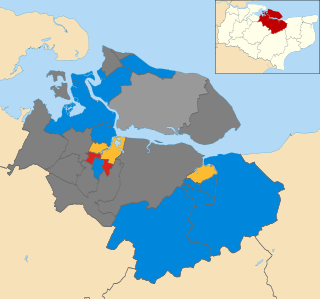
The 2008 Swale Borough Council election took place on 1 May 2008 to elect members of Swale Borough Council in Kent, England. One third of the council was up for election and the Conservative party stayed in overall control of the council.
The 2010 Swale Borough Council election took place on 6 May 2010 to elect members of Swale Borough Council in Kent, England. One third of the council was up for election and the Conservative party stayed in overall control of the council.
The 2011 Swale Borough Council election took place on 5 May 2011 to elect members of Swale Borough Council in Kent, England. The whole council was up for election and the Conservative party stayed in overall control of the council.
The 2003 Christchurch Borough Council election took place on 1 May 2003 to elect members of Christchurch Borough Council in Dorset, England. The whole council was up for election after boundary changes reduced the number of seats by one. The Conservative party stayed in overall control of the council.
The 2007 Christchurch Borough Council election took place on 3 May 2007 to elect members of Christchurch Borough Council in Dorset, England. The whole council was up for election and the Conservative party stayed in overall control of the council.