| Timeline of the 2014 Pacific hurricane season | |||||
|---|---|---|---|---|---|
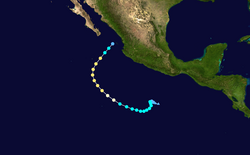
 Season summary map | |||||
| Season boundaries | |||||
| First system formed | May 22, 2014 | ||||
| Last system dissipated | November 5, 2014 | ||||
| Strongest system | |||||
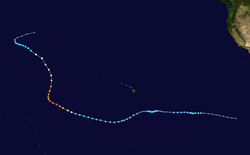
| Name | Marie | ||||
| Maximum winds | 160 mph (260 km/h) (1-minute sustained) | ||||
| Lowest pressure | 918 mbar (hPa; 27.11 inHg) | ||||
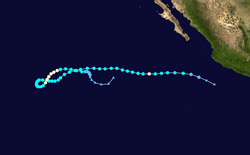
| Longest lasting system | |||||
| Name | Karina | ||||
| Duration | 13.75 days | ||||
| |||||
The 2014 Pacific hurricane season consisted of the events that occurred in the annual cycle of tropical cyclone formation over the Pacific Ocean north of the equator and east of the International Date Line. The official bounds of each Pacific hurricane season are dates that conventionally delineate the period each year during which tropical cyclones tend to form in the basin according to the National Hurricane Center (NHC), beginning on May 15 in the Eastern Pacific proper (east of 140°W) and June 1 in the Central Pacific (140°W to the International Date Line), and ending on November 30 in both areas. However, tropical cyclogenesis is possible at any time of year. [1] The first tropical cyclone of the season, Hurricane Amanda, developed on May 22; the final, Hurricane Vance, dissipated on November 5.
Contents
On account of several unusually favorable atmospheric and oceanic factors, [2] the 2014 season was one of the most active on record for the basin. It produced twenty-three tropical depressions, of which all but one developed into named tropical storms; sixteen became hurricanes, of which nine further intensified into major hurricanes. [nb 1] [3] All of these parameters exceeded the 1981–2010 averages of 16.5 tropical storms, 8.9 hurricanes, and 4.3 major hurricanes; the number of hurricanes was tied with 1990 and 1992 for the most in one season since reliable records began. [4] The season's activity levels were reflected by an overall Accumulated Cyclone Energy index of 202.4 units, which is the seventh-highest value for a Pacific hurricane season as of July 2024. [nb 2] [6]
Multiple tropical cyclones impacted land or were otherwise notable for meteorological reasons. The season's most impactful was Hurricane Odile in mid-September, [2] which caused extensive damage throughout Baja California Sur after it made landfall near Cabo San Lucas as a strong Category 3 hurricane with maximum sustained winds of 125 mph (205 km/h). It later struck the mainland of northwestern Mexico as a tropical storm, and its remnants generated severe thunderstorms and intense flooding in portions of the Southwestern United States. [7] Odile and its remnants killed more than a dozen people and wrought US$1–1.25 billion in damage, [7] [8] resulting in its name being retired the following spring. [9]
Hurricane Iselle in early August was the strongest recorded tropical cyclone to make landfall on Hawaii's Big Island; torrential rainfall of up to 15.25 in (38.74 cm) caused significant flooding, with damage exacerbated by strong winds. The state of Hawaii incurred at least US$148 million in losses, and one person was killed. [10] Later that month, Hurricane Marie reached Category 5 status and became the seventh-most intense Pacific hurricane on record—tied with Odile—when it reached a barometric pressure of 918 mbar (27.11 inHg). [3] Marie's large size and immense strength produced high surf that drowned four people in the United States and Mexico; damages totaled US$20 million in the former country, [11] while flooding from peripheral rains in the latter caused two additional fatalities. [12] Hurricane Amanda was the strongest Pacific hurricane ever recorded in the month of May, peaking with maximum sustained winds of 155 mph (250 km/h) and a minimum barometric pressure of 932 mbar (27.52 inHg); however, it did not directly affect land. [13]
Prior to 2015, two time zones were utilized in the Eastern Pacific basin: Pacific east of 140°W, and Hawaii−Aleutian from 140°W to the International Date Line. [14] [15] For convenience, each event is listed in Coordinated Universal Time (UTC) first, using the 24-hour clock (where 00:00 = midnight UTC), [16] with the respective local time included in parentheses. Figures for maximum sustained winds and position estimates are rounded to the nearest five units (knots, miles, or kilometers) and averaged over one minute, following National Hurricane Center practice. Direct wind observations are rounded to the nearest whole number. Atmospheric pressures are listed to the nearest millibar and nearest hundredth of an inch of mercury. This timeline documents the formation of tropical cyclones as well as the strengthening, weakening, landfalls, extratropical transitions, and dissipations during the season. It also includes information that was not released while the storm was active, meaning that data from post-storm reviews by the National Hurricane Center and the Central Pacific Hurricane Center is included.