The 2004 West Oxfordshire District Council election took place on 10 June 2004 to elect members of West Oxfordshire District Council in Oxfordshire, England. One third of the council was up for election and the Conservative party stayed in overall control of the council. [1]
West Oxfordshire is a local government district in northwest Oxfordshire, England, including towns such as Woodstock, Burford, Chipping Norton, Charlbury, Carterton and Witney, where the council is based.
Non-metropolitan districts, or colloquially "shire districts", are a type of local government district in England. As created, they are sub-divisions of non-metropolitan counties in a two-tier arrangement.
Oxfordshire is a county in South East England. The ceremonial county borders Warwickshire to the north-west, Northamptonshire to the north-east, Buckinghamshire to the east, Berkshire to the south, Wiltshire to the south-west and Gloucestershire to the west.
After the election, the composition of the council was
The Conservative Party, officially the Conservative and Unionist Party, is a centre-right political party in the United Kingdom. The governing party since 2010, it is the largest in the House of Commons, with 313 Members of Parliament, and also has 249 members of the House of Lords, 18 members of the European Parliament, 31 Members of the Scottish Parliament, 12 members of the Welsh Assembly, eight members of the London Assembly and 8,916 local councillors.
The Liberal Democrats are a liberal political party in the United Kingdom. It is currently led by Vince Cable. They have 11 Members of Parliament in the House of Commons, 96 members of the House of Lords, one member of the European Parliament, five Members of the Scottish Parliament and one member in the Welsh Assembly and London Assembly. At the height of its influence, the party formed a coalition government with the Conservative Party from 2010 to 2015 with its leader Nick Clegg serving as Deputy Prime Minister.
The Labour Party is a centre-left political party in the United Kingdom that has been described as an alliance of social democrats, democratic socialists and trade unionists. The party's platform emphasises greater state intervention, social justice and strengthening workers' rights.
After the last election in 2003 the Conservatives controlled the council with 29 seats, while the Liberal Democrats had 12, there were six independent councillors and the Labour party had two seats. [3] A total of 54 candidates stood for the 17 seats up for election in 2004, comprising 16 each for the Conservatives and Liberal Democrats, 11 Labour candidates, nine Green party and two independents. [4]
A Councillor is a member of a local government council.
The Green Party of England and Wales is a green, left-wing political party in England and Wales. Headquartered in London, since September 2018, its co-leaders are Siân Berry and Jonathan Bartley. The Green Party has one representative in the House of Commons, one in the House of Lords, and three in the European Parliament. In addition, it has various councillors in UK local government and two members of the London Assembly.
The Conservatives remained in control of the council with 29 councillors, after winning 12 of the 17 seats contested. [5] 13 of the 14 councillors who were standing again were re-elected, with only Conservative councillor James Mills losing his seat in Standlake, Aston and Stanton Harcourt ward to Liberal Democrat Elisabeth Bickley. [4] The Liberal Democrats took four seats and therefore finished with 13 councillors on the council., [5] while all three members of the Conservative council cabinet were re-elected, including the council leader Barry Norton in North Leigh ward. [6]
Standlake is a village and civil parish about 5 miles (8 km) southeast of Witney and 7 miles (11 km) west of Oxford, England in the district of West Oxfordshire. The parish includes the hamlet of Brighthampton. The 2011 Census recorded the parish's population as 1,497.
Aston is a village about 4 miles (6.4 km) south of Witney in West Oxfordshire, England. The village is part of the civil parish of Aston, Cote, Shifford and Chimney. The southern boundary of the parish is the River Thames. The 2011 Census recorded the parish's population as 1,374.
Stanton Harcourt is a village and civil parish in Oxfordshire about 4 miles (6.4 km) southeast of Witney and about 6 miles (10 km) west of Oxford. The parish includes the hamlet of Sutton, 1⁄2 mile (800 m) north of the village. The 2011 Census recorded the parish's population as 960.
Conservative Andrew Creery also gained one seat in Witney Central from Labour, after the Labour councillor for the previous 30 years, Ted Cooper, stood down at the election. [6] This reduced Labour to its worst ever position on the council with just one councillor. [6] Meanwhile, independent councillor Derrick Millard retained his seat in Stonesfield and Tackley, to mean there remained six independent councillors. [4] Overall turnout at the election was 45.19%. [4]
Witney is a historic market town on the River Windrush, 12 miles (19 km) west of Oxford in Oxfordshire, England.
Stonesfield is a village and civil parish about 5 miles (8 km) north of Witney in Oxfordshire, and about 10 miles (17km) northwest of Oxford.
Tackley is a village and civil parish beside the River Cherwell in Oxfordshire, England. It is about 6 miles (10 km) west of Bicester and 4 1⁄2 miles (7 km) north of Kidlington. The village consists of two neighbourhoods: Tackley itself, and Nethercott. The 2011 Census recorded the parish's population as 998.
Party | Seats | Gains | Losses | Net gain/loss | Seats % | Votes % | Votes | +/− | |
---|---|---|---|---|---|---|---|---|---|
Conservative | 12 | 1 | 1 | 0 | 70.6 | 46.5 | 10,996 | +7.9% | |
Liberal Democrat | 4 | 1 | 0 | +1 | 23.5 | 30.4 | 7,180 | -0.1% | |
Independent | 1 | 0 | 0 | 0 | 5.9 | 5.8 | 1,360 | -8.2% | |
Labour | 0 | 0 | 1 | -1 | 0 | 10.2 | 2,419 | -1.0% | |
Green | 0 | 0 | 0 | 0 | 0 | 7.1 | 1,686 | +2.3% |
Party | Candidate | Votes | % | ± | |
---|---|---|---|---|---|
Conservative | Terence Owen | 499 | 66.0 | +0.5 | |
Liberal Democrat | Elizabeth Leffman | 152 | 20.1 | -14.4 | |
Labour | Georgina Burrows | 105 | 13.9 | +13.9 | |
Majority | 347 | 45.9 | +15.0 | ||
Turnout | 756 | 49.9 | +9.9 | ||
Conservative hold | Swing |
Party | Candidate | Votes | % | ± | |
---|---|---|---|---|---|
Liberal Democrat | Glena Chadwick | 985 | 66.7 | +4.5 | |
Conservative | Ian Lyne | 491 | 33.3 | +33.3 | |
Majority | 494 | 33.5 | +3.9 | ||
Turnout | 1,476 | 50.9 | +9.7 | ||
Liberal Democrat hold | Swing |
Party | Candidate | Votes | % | ± | |
---|---|---|---|---|---|
Conservative | Michael Howes | 964 | 49.0 | +9.5 | |
Labour | Mark Walker | 478 | 24.3 | -22.3 | |
Liberal Democrat | Elizabeth Allen | 363 | 18.4 | +4.4 | |
Green | Rachel Griffiths | 163 | 8.3 | +8.3 | |
Majority | 486 | 24.7 | |||
Turnout | 1,968 | 44.1 | +8.2 | ||
Conservative hold | Swing |
Party | Candidate | Votes | % | ± | |
---|---|---|---|---|---|
Liberal Democrat | Margaret Stevens | 1,045 | 54.8 | -3.0 | |
Conservative | Frances Pike | 662 | 34.7 | +0.4 | |
Green | Xanthe Bevis | 201 | 10.5 | +2.6 | |
Majority | 383 | 20.1 | -3.3 | ||
Turnout | 1,908 | 43.0 | +10.5 | ||
Liberal Democrat hold | Swing |
Party | Candidate | Votes | % | ± | |
---|---|---|---|---|---|
Liberal Democrat | Stuart Brooks | 935 | 55.9 | ||
Conservative | Jill Dunsmore | 737 | 44.1 | ||
Majority | 198 | 11.8 | |||
Turnout | 1,672 | 52.1 | +6.0 | ||
Liberal Democrat hold | Swing |
Party | Candidate | Votes | % | ± | |
---|---|---|---|---|---|
Conservative | Simon Hoare | 942 | 68.3 | +3.3 | |
Liberal Democrat | Malcolm West | 306 | 22.2 | -12.8 | |
Labour | William Tumbridge | 131 | 9.5 | +9.5 | |
Majority | 636 | 46.1 | +16.0 | ||
Turnout | 1,379 | 44.9 | +8.6 | ||
Conservative hold | Swing |
Party | Candidate | Votes | % | ± | |
---|---|---|---|---|---|
Conservative | Anthony Walker | 899 | 62.1 | +1.2 | |
Liberal Democrat | Christopher Tatton | 286 | 19.8 | -0.2 | |
Labour | Melanie Deans | 262 | 18.1 | -0.9 | |
Majority | 613 | 42.4 | +1.5 | ||
Turnout | 1,447 | 46.0 | +11.3 | ||
Conservative hold | Swing |
Party | Candidate | Votes | % | ± | |
---|---|---|---|---|---|
Conservative | Jeffrey Haine | 571 | 74.2 | -2.2 | |
Liberal Democrat | John Lilly | 199 | 25.8 | +2.2 | |
Majority | 372 | 48.3 | -4.5 | ||
Turnout | 770 | 49.2 | +5.4 | ||
Conservative hold | Swing |
Party | Candidate | Votes | % | ± | |
---|---|---|---|---|---|
Conservative | Barry Norton | 513 | 60.2 | ||
Liberal Democrat | Philip Workman | 200 | 23.5 | ||
Labour | Helen Bridge | 139 | 16.3 | ||
Majority | 313 | 36.7 | |||
Turnout | 852 | 56.3 | |||
Conservative hold | Swing |
Party | Candidate | Votes | % | ± | |
---|---|---|---|---|---|
Liberal Democrat | Elisabeth Bickley | 831 | 51.7 | ||
Conservative | James Mills | 775 | 48.3 | ||
Majority | 56 | 3.5 | |||
Turnout | 1,606 | 52.1 | +9.0 | ||
Liberal Democrat gain from Conservative | Swing | ||||
Party | Candidate | Votes | % | ± | |
---|---|---|---|---|---|
Independent | Derrick Millard | 1,060 | 69.3 | -0.6 | |
Liberal Democrat | Gillian Workman | 249 | 16.3 | -0.2 | |
Green | Susan Turnbull | 220 | 14.4 | +0.8 | |
Majority | 811 | 53.0 | -0.5 | ||
Turnout | 1,529 | 48.8 | +12.8 | ||
Independent hold | Swing |
Party | Candidate | Votes | % | ± | |
---|---|---|---|---|---|
Conservative | Andrew Creery | 524 | 42.9 | +14.2 | |
Labour | Richard Kelsall | 339 | 27.7 | +2.8 | |
Liberal Democrat | June Taylor | 217 | 17.8 | +4.6 | |
Green | Sandra Simpson | 142 | 11.6 | +8.4 | |
Majority | 185 | 15.1 | |||
Turnout | 1,222 | 41.1 | +1.7 | ||
Conservative gain from Labour | Swing | ||||
Party | Candidate | Votes | % | ± | |
---|---|---|---|---|---|
Conservative | Frank Smith | 710 | 49.4 | +16.8 | |
Liberal Democrat | Peter Madden | 341 | 23.7 | -27.2 | |
Green | Enid Dossett-Davies | 218 | 15.2 | +9.3 | |
Labour | Raymond Harris | 169 | 11.8 | +1.3 | |
Majority | 369 | 25.7 | |||
Turnout | 1,438 | 38.3 | +6.8 | ||
Conservative hold | Swing |
Party | Candidate | Votes | % | ± | |
---|---|---|---|---|---|
Conservative | Martin Chapman | 569 | 45.2 | +6.7 | |
Green | Richard Dossett-Davies | 324 | 25.7 | +5.9 | |
Liberal Democrat | Paul Slamin | 239 | 19.0 | -22.7 | |
Labour | Diana Kelsall | 128 | 10.2 | +10.2 | |
Majority | 245 | 19.4 | |||
Turnout | 1,260 | 41.1 | +6.4 | ||
Conservative hold | Swing |
Party | Candidate | Votes | % | ± | |
---|---|---|---|---|---|
Conservative | Peter Green | 863 | 52.7 | +21.7 | |
Labour | Phillip Edney | 317 | 19.3 | +2.3 | |
Liberal Democrat | Olive Minett | 282 | 17.2 | +6.6 | |
Green | Jill Jones | 177 | 10.8 | +5.8 | |
Majority | 546 | 33.3 | +27.7 | ||
Turnout | 1,639 | 36.3 | +6.8 | ||
Conservative hold | Swing |
Party | Candidate | Votes | % | ± | |
---|---|---|---|---|---|
Conservative | Louise Chapman | 574 | 51.3 | +9.5 | |
Independent | Ian Lucas | 300 | 26.8 | +1.9 | |
Labour | David Wesson | 142 | 12.7 | -1.6 | |
Green | Christopher Marchant | 102 | 9.1 | +2.8 | |
Majority | 274 | 24.5 | +7.6 | ||
Turnout | 1,118 | 37.0 | +13.0 | ||
Conservative hold | Swing |
Party | Candidate | Votes | % | ± | |
---|---|---|---|---|---|
Conservative | Ian Hudspeth | 703 | 43.9 | ||
Liberal Democrat | Elizabeth Poskitt | 550 | 34.4 | ||
Labour | Susan Roberts | 209 | 13.1 | ||
Green | Tracy Dighton-Brown | 139 | 8.7 | ||
Majority | 153 | 9.6 | |||
Turnout | 1,601 | 53.7 | +5.8 | ||
Conservative hold | Swing |
Party | Candidate | Votes | % | ± | |
---|---|---|---|---|---|
Conservative | Roger Curry | 420 | 50.5 | +1.1 | |
Liberal Democrat | Daniel Coulson | 253 | 30.4 | +6.7 | |
Green | Enid Dossett-Davies | 109 | 13.1 | -2.1 | |
Labour | David Wesson | 49 | 5.9 | -5.9 | |
Majority | 167 | 20.1 | -5.6 | ||
Turnout | 831 | 19.8 | -18.5 | ||
Conservative hold | Swing |
The 1999 Craven District Council election took place on 6 May 1999 to elect members of Craven District Council in North Yorkshire, England. One third of the council was up for election and the Conservative party gained overall control of the council from no overall control.
The 2004 Craven District Council election took place on 10 June 2004 to elect members of Craven District Council in North Yorkshire, England. One third of the council was up for election and the council stayed under no overall control.
The 2007 St Albans City and District Council election took place on 3 May 2007 to elect members of St Albans District Council in Hertfordshire, England. One third of the council was up for election and the Liberal Democrats lost overall control of the council to no overall control.
The 2011 Derbyshire Dales District Council election took place on 5 May 2011 to elect members of Derbyshire Dales District Council in Derbyshire, England. The whole council was up for election and the Conservative party stayed in overall control of the council.
The 2003 Rother District Council election took place on 1 May 2003 to elect members of Rother District Council in East Sussex, England. The whole council was up for election after boundary changes reduced the number of seats by 7. The Conservative party stayed in overall control of the council.
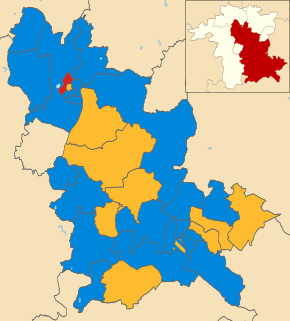
The 2003 Wychavon District Council election took place on 1 May 2003 to elect members of Wychavon District Council in Worcestershire, England. The whole council was up for election with boundary changes since the last election in 1999 reducing the number of seats by four. The Conservative party stayed in overall control of the council.
The 2003 South Kesteven District Council election took place on 1 May 2003 to elect members of South Kesteven District Council in Lincolnshire, England. The whole council was up for election and the Conservative party gained control of the council from no overall control.
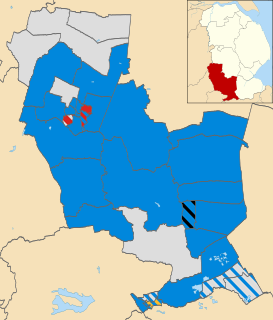
The 2011 South Kesteven District Council election took place on 5 May 2011 to elect members of South Kesteven District Council in Lincolnshire, England. The whole council was up for election and the Conservative party stayed in overall control of the council.
The 2015 Christchurch Borough Council election took place on 7 May 2015 to elect members of Christchurch Borough Council in Dorset, England. The whole council was up for election and the Conservative party stayed in overall control of the council.
The 1998 West Oxfordshire District Council election took place on 7 May 1998 to elect members of West Oxfordshire District Council in Oxfordshire, England. One third of the council was up for election and the council stayed under no overall control.
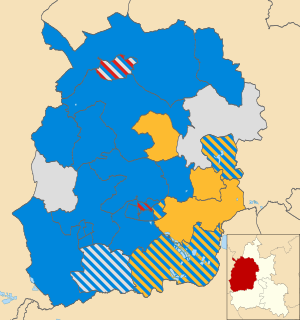
The 2002 West Oxfordshire District Council election took place on 2 May 2002 to elect members of West Oxfordshire District Council in Oxfordshire, England. The whole council was up for election with boundary changes since the last election in 2000. The Conservative party stayed in overall control of the council.
The 2003 West Oxfordshire District Council election took place on 1 May 2003 to elect members of West Oxfordshire District Council in Oxfordshire, England. One third of the council was up for election and the Conservative party stayed in overall control of the council.
The 2006 West Oxfordshire District Council election took place on 4 May 2006 to elect members of West Oxfordshire District Council in Oxfordshire, England. One third of the council was up for election and the Conservative party stayed in overall control of the council.
The 2007 West Oxfordshire District Council election took place on 3 May 2007 to elect members of West Oxfordshire District Council in Oxfordshire, England. One third of the council was up for election and the Conservative party stayed in overall control of the council.
The 2008 West Oxfordshire District Council election took place on 1 May 2008 to elect members of West Oxfordshire District Council in Oxfordshire, England. One third of the council was up for election and the Conservative party stayed in overall control of the council.
The 2010 West Oxfordshire District Council election took place on 6 May 2010 to elect members of West Oxfordshire District Council in Oxfordshire, England. One third of the council was up for election and the Conservative party stayed in overall control of the council.
The 2011 West Oxfordshire District Council election took place on 5 May 2011 to elect members of West Oxfordshire District Council in Oxfordshire, England. One third of the council was up for election and the Conservative party stayed in overall control of the council.
The 2012 West Oxfordshire District Council election took place on 3 May 2012 to elect members of West Oxfordshire District Council in Oxfordshire, England. One third of the council was up for election and the Conservative party stayed in overall control of the council.
The 2014 West Oxfordshire District Council election took place on 22 May 2014 to elect members of West Oxfordshire District Council in Oxfordshire, England. One third of the council was up for election and the Conservative party stayed in overall control of the council.
The 2015 West Oxfordshire District Council election took place on 22 May 2015 to elect members of West Oxfordshire District Council in Oxfordshire, England. One third of the council was up for election and the Conservative party stayed in overall control of the council.