The 2008 West Oxfordshire District Council election took place on 1 May 2008 to elect members of West Oxfordshire District Council in Oxfordshire, England. One third of the council was up for election and the Conservative party stayed in overall control of the council. [1]
West Oxfordshire is a local government district in northwest Oxfordshire, England, including towns such as Woodstock, Burford, Chipping Norton, Charlbury, Carterton and Witney, where the council is based.
Non-metropolitan districts, or colloquially "shire districts", are a type of local government district in England. As created, they are sub-divisions of non-metropolitan counties in a two-tier arrangement.
Oxfordshire is a county in South East England. The ceremonial county borders Warwickshire to the north-west, Northamptonshire to the north-east, Buckinghamshire to the east, Berkshire to the south, Wiltshire to the south-west and Gloucestershire to the west.
After the election, the composition of the council was
The Conservative Party, officially the Conservative and Unionist Party, is a centre-right political party in the United Kingdom. The governing party since 2010, it is the largest in the House of Commons, with 313 Members of Parliament, and also has 249 members of the House of Lords, 18 members of the European Parliament, 31 Members of the Scottish Parliament, 12 members of the Welsh Assembly, eight members of the London Assembly and 8,916 local councillors.
The Liberal Democrats are a liberal political party in the United Kingdom. It is currently led by Vince Cable. They have 11 Members of Parliament in the House of Commons, 96 members of the House of Lords, one member of the European Parliament, five Members of the Scottish Parliament and one member in the Welsh Assembly and London Assembly. At the height of its influence, the party formed a coalition government with the Conservative Party from 2010 to 2015 with its leader Nick Clegg serving as Deputy Prime Minister.
The Labour Party is a centre-left political party in the United Kingdom that has been described as an alliance of social democrats, democratic socialists and trade unionists. The party's platform emphasises greater state intervention, social justice and strengthening workers' rights.
Before the election the Conservatives controlled the council with 36 councillors, compared to eight for the Liberal Democrats, four independents and one Labour councillor. [3] 17 of the 49 seats on the council were up for election in 2008, which meant the Conservatives were guaranteed to keep a majority. [4]
A Councillor is a member of a local government council.
The Conservative leader of the council, Barry Norton, in North Leigh ward was one of four Conservatives who were elected without opposition, with the Conservatives being the only party to have a full 17 candidates. [4] Both the Liberal Democrats and Green party had eight candidates, Labour had five candidates, UK Independence Party two and there were two independents. [4]
North Leigh is a village and civil parish about 3 miles (5 km) northeast of Witney in Oxfordshire. The parish includes the hamlet of East End, and since 1932 has also included the hamlet of Wilcote. The 2011 Census recorded the parish's population as 1,929.
The wards and electoral divisions in the United Kingdom are electoral districts at sub-national level represented by one or more councillors. The ward is the primary unit of English electoral geography for civil parishes and borough and district councils, electoral ward is the unit used by Welsh principal councils, while the electoral division is the unit used by English county councils and some unitary authorities. Each ward/division has an average electorate of about 5,500 people, but ward-population counts can vary substantially. As at the end of 2014 there were 9,456 electoral wards/divisions in the UK.
The Green Party of England and Wales is a green, left-wing political party in England and Wales. Headquartered in London, since September 2018, its co-leaders are Siân Berry and Jonathan Bartley. The Green Party has one representative in the House of Commons, one in the House of Lords, and three in the European Parliament. In addition, it has various councillors in UK local government and two members of the London Assembly.
13 councillors sought re-election, with the councillors who stood down at the election including the Conservative former council chairman Tony Walker from Kingham, Rollright and Enstone ward, the Liberal Democrat group leader Stuart Brooks of Freeland and Hanborough ward, and independent Derrick Millard of Stonesfield and Tackley ward. [4] [5]
Kingham is a village and civil parish in the Cotswolds about 4 miles (6.4 km) southwest of Chipping Norton, Oxfordshire. The 2011 Census recorded the parish's population as 913.
Rollright is a civil parish in West Oxfordshire, England. It contains the villages of Great Rollright and Little Rollright and some of the prehistoric Rollright Stones. The parish is on West Oxfordshire's boundary with Cherwell District and Oxfordshire's boundary with Warwickshire.
Enstone is an English village and civil parish about 4 miles (6.4 km) east of Chipping Norton, and 15 miles (24 km) north-west of Oxford city. The civil parish, one of the largest in Oxfordshire, consists of the villages of Church Enstone and Neat Enstone, with the hamlets of Chalford, Cleveley, Fulwell, Gagingwell, Lidstone, and Radford. The 2011 Census recorded the parish population as 1,139, living in 453 households.
The Conservatives gained four seats to win 11 of the 13 seats contested. [6] This took the Conservatives to 40 of the 49 councillors and reduced the opposition to its lowest level on the council as of 2008. [6] Conservative gains included taking Witney South from independent, former Witney mayor, Peter Green, while Conservative Ian Hudspeth held Woodstock and Bladon by 45 votes. [6] [7]
Witney is a historic market town on the River Windrush, 12 miles (19 km) west of Oxford in Oxfordshire, England.
Woodstock is a market town and civil parish 8 miles (13 km) northwest of Oxford in Oxfordshire, England. The 2011 Census recorded the parish population as 3,100.
Bladon is a village and civil parish on the River Glyme about 6 1⁄2 miles (10.5 km) northwest of Oxford, Oxfordshire, England, notable as the burial place of Sir Winston Churchill. The 2011 Census recorded the parish's population as 898.
The Liberal Democrats lost two seats to be reduced to four councillors, although Margaret Stevens narrowly held Eynsham and Cassington for the party by four votes. [6] Meanwhile, the number of independents was reduced by two to two councillors, while Labour remained with one councillor. [6] Overall 11 of the 13 councillors who stood were re-elected with average turnout at the election being 39.84%. [5]
Party | Seats | Gains | Losses | Net gain/loss | Seats % | Votes % | Votes | +/− | |
---|---|---|---|---|---|---|---|---|---|
Conservative | 15 | 4 | 0 | +4 | 88.2 | 56.5 | 10,194 | +4.1% | |
Liberal Democrat | 2 | 0 | 2 | -2 | 11.8 | 22.5 | 4,065 | +3.2% | |
Green | 0 | 0 | 0 | 0 | 0 | 8.5 | 1,527 | -2.1% | |
Labour | 0 | 0 | 0 | 0 | 0 | 7.9 | 1,416 | -1.7% | |
Independent | 0 | 0 | 2 | -2 | 0 | 3.5 | 629 | -3.2% | |
UKIP | 0 | 0 | 0 | 0 | 0 | 1.1 | 203 | -0.2% |
Party | Candidate | Votes | % | ± | |
---|---|---|---|---|---|
Conservative | Terence Owen | 560 | 78.4 | +12.4 | |
Liberal Democrat | Christopher Tatton | 154 | 21.6 | +1.5 | |
Majority | 406 | 56.9 | +11.0 | ||
Turnout | 714 | 45.3 | -4.6 | ||
Conservative hold | Swing |
Party | Candidate | Votes | % | ± | |
---|---|---|---|---|---|
Liberal Democrat | Glena Chadwick | 883 | 58.0 | +5.2 | |
Conservative | Gill Hill | 639 | 42.0 | +3.3 | |
Majority | 244 | 16.0 | +1.9 | ||
Turnout | 1,522 | 51.6 | +0.4 | ||
Liberal Democrat hold | Swing |
Party | Candidate | Votes | % | ± | |
---|---|---|---|---|---|
Conservative | Patrick McHugh | 1,005 | 49.4 | +10.1 | |
Labour | Rob Evans | 620 | 30.5 | -16.8 | |
Independent | Keith Greenwell | 304 | 14.9 | +1.5 | |
Green | Brian Luney | 105 | 5.2 | +5.2 | |
Majority | 385 | 18.9 | |||
Turnout | 2,034 | 41.1 | -1.8 | ||
Conservative hold | Swing |
Party | Candidate | Votes | % | ± | |
---|---|---|---|---|---|
Liberal Democrat | Margaret Stevens | 825 | 45.7 | -3.4 | |
Conservative | Sheila Bibb | 821 | 45.5 | +8.5 | |
Green | Katharine Nathan | 158 | 8.8 | +2.1 | |
Majority | 4 | 0.2 | -11.9 | ||
Turnout | 1,804 | 40.5 | -1.6 | ||
Liberal Democrat hold | Swing |
Party | Candidate | Votes | % | ± | |
---|---|---|---|---|---|
Conservative | Toby Morris | 727 | 49.9 | +1.0 | |
Liberal Democrat | Mike Baggaley | 632 | 43.4 | +3.0 | |
Labour | Hugh Burton | 98 | 6.7 | +2.7 | |
Majority | 95 | 6.5 | -2.1 | ||
Turnout | 1,457 | 44.3 | -1.4 | ||
Conservative gain from Liberal Democrat | Swing | ||||
Party | Candidate | Votes | % | ± | |
---|---|---|---|---|---|
Conservative | Simon Hoare | unopposed | |||
Conservative hold | Swing |
Party | Candidate | Votes | % | ± | |
---|---|---|---|---|---|
Conservative | Dennis Stickley | unopposed | |||
Conservative hold | Swing |
Party | Candidate | Votes | % | ± | |
---|---|---|---|---|---|
Conservative | Jeff Haine | unopposed | |||
Conservative hold | Swing |
Party | Candidate | Votes | % | ± | |
---|---|---|---|---|---|
Conservative | Barry Norton | unopposed | |||
Conservative hold | Swing |
Party | Candidate | Votes | % | ± | |
---|---|---|---|---|---|
Conservative | Hilary Fenton | 939 | 58.7 | +10.4 | |
Liberal Democrat | Elisabeth Bickley | 660 | 41.3 | -10.4 | |
Majority | 279 | 17.4 | |||
Turnout | 1,599 | 49.3 | +1.7 | ||
Conservative gain from Liberal Democrat | Swing | ||||
Party | Candidate | Votes | % | ± | |
---|---|---|---|---|---|
Conservative | Gillian Oldfield | 898 | 69.5 | +69.5 | |
Green | Susan Turnbull | 395 | 30.5 | +1.5 | |
Majority | 503 | 38.9 | |||
Turnout | 1,293 | 40.8 | +0.8 | ||
Conservative gain from Independent | Swing | ||||
Party | Candidate | Votes | % | ± | |
---|---|---|---|---|---|
Conservative | Colin Adams | 703 | 62.8 | +9.4 | |
Labour | Philip Edney | 250 | 22.3 | +3.4 | |
Green | Stuart MacDonald | 89 | 8.0 | -3.6 | |
Liberal Democrat | Brenda Churchill | 77 | 6.9 | -9.2 | |
Majority | 453 | 40.5 | +6.0 | ||
Turnout | 1,119 | 33.1 | -0.2 | ||
Conservative hold | Swing |
Party | Candidate | Votes | % | ± | |
---|---|---|---|---|---|
Conservative | Roger Curry | 1,108 | 63.6 | +5.9 | |
Labour | Duncan Enright | 311 | 17.9 | +1.1 | |
Green | Enid Dossett-Davies | 198 | 11.4 | +0.5 | |
UKIP | James Mawle | 124 | 7.1 | +7.1 | |
Majority | 797 | 45.8 | +5.0 | ||
Turnout | 1,741 | 32.4 | -0.7 | ||
Conservative hold | Swing |
Party | Candidate | Votes | % | ± | |
---|---|---|---|---|---|
Conservative | Martin Chapman | 594 | 54.1 | +2.7 | |
Green | Richard Dossett-Davies | 314 | 28.6 | -3.5 | |
Liberal Democrat | Ruth Smith | 189 | 17.2 | +0.7 | |
Majority | 280 | 25.5 | +6.3 | ||
Turnout | 1,097 | 35.1 | -1.9 | ||
Conservative hold | Swing |
Party | Candidate | Votes | % | ± | |
---|---|---|---|---|---|
Conservative | Jane Doughty | 810 | 58.4 | +3.2 | |
Independent | Peter Green | 325 | 23.4 | +23.4 | |
Green | Jill Jones | 174 | 12.5 | +1.5 | |
UKIP | David Phipps | 79 | 5.7 | -2.5 | |
Majority | 485 | 34.9 | -6.3 | ||
Turnout | 1,388 | 30.7 | -4.0 | ||
Conservative gain from Independent | Swing | ||||
Party | Candidate | Votes | % | ± | |
---|---|---|---|---|---|
Conservative | Louise Chapman | 705 | 75.3 | -4.0 | |
Labour | Dave Wesson | 137 | 14.6 | +14.6 | |
Green | Sandra Simpson | 94 | 10.0 | -10.7 | |
Majority | 568 | 60.7 | +2.1 | ||
Turnout | 936 | 30.3 | -0.5 | ||
Conservative hold | Swing |
Party | Candidate | Votes | % | ± | |
---|---|---|---|---|---|
Conservative | Ian Hudspeth | 685 | 51.5 | +7.5 | |
Liberal Democrat | Elizabeth Poskitt | 645 | 48.5 | +6.8 | |
Majority | 40 | 3.0 | +0.7 | ||
Turnout | 1,330 | 43.6 | -5.5 | ||
Conservative hold | Swing |
The 1999 Craven District Council election took place on 6 May 1999 to elect members of Craven District Council in North Yorkshire, England. One third of the council was up for election and the Conservative party gained overall control of the council from no overall control.
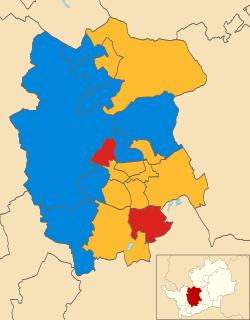
The 2006 St Albans City and District Council election took place on 4 May 2006 to elect members of St Albans District Council in Hertfordshire, England. One third of the council was up for election and the Liberal Democrats gained overall control of the council from no overall control.
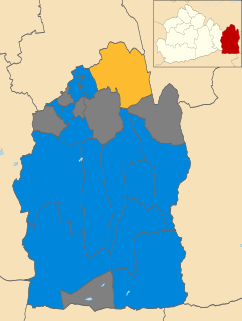
The 2010 Tandridge District Council election took place on 6 May 2010 to elect members of Tandridge District Council in Surrey, England. One third of the council was up for election and the Conservative party stayed in overall control of the council.
The 2012 Tandridge District Council election took place on 3 May 2012 to elect members of Tandridge District Council in Surrey, England. One third of the council was up for election and the Conservative party stayed in overall control of the council.
The 2014 Craven District Council election took place on 22 May 2014 to elect members of Craven District Council in North Yorkshire, England. One third of the council was up for election and the Conservative party stayed in overall control of the council.
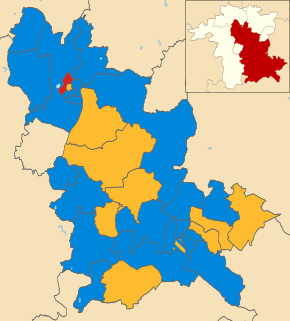
The 2003 Wychavon District Council election took place on 1 May 2003 to elect members of Wychavon District Council in Worcestershire, England. The whole council was up for election with boundary changes since the last election in 1999 reducing the number of seats by four. The Conservative party stayed in overall control of the council.
The 2015 Wychavon District Council election took place on 7 May 2015 to elect members of Wychavon District Council in Worcestershire, England. The whole council was up for election and the Conservative party stayed in overall control of the council.
The 1998 West Oxfordshire District Council election took place on 7 May 1998 to elect members of West Oxfordshire District Council in Oxfordshire, England. One third of the council was up for election and the council stayed under no overall control.
The 2000 West Oxfordshire District Council election took place on 4 May 2000 to elect members of West Oxfordshire District Council in Oxfordshire, England. One third of the council was up for election and the Conservative party gained overall control of the council from no overall control.
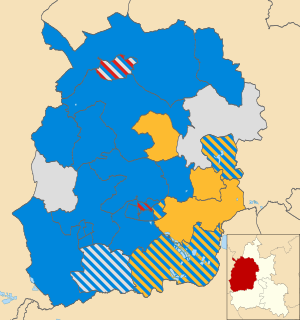
The 2002 West Oxfordshire District Council election took place on 2 May 2002 to elect members of West Oxfordshire District Council in Oxfordshire, England. The whole council was up for election with boundary changes since the last election in 2000. The Conservative party stayed in overall control of the council.
The 2003 West Oxfordshire District Council election took place on 1 May 2003 to elect members of West Oxfordshire District Council in Oxfordshire, England. One third of the council was up for election and the Conservative party stayed in overall control of the council.
The 2004 West Oxfordshire District Council election took place on 10 June 2004 to elect members of West Oxfordshire District Council in Oxfordshire, England. One third of the council was up for election and the Conservative party stayed in overall control of the council.
The 2006 West Oxfordshire District Council election took place on 4 May 2006 to elect members of West Oxfordshire District Council in Oxfordshire, England. One third of the council was up for election and the Conservative party stayed in overall control of the council.
The 2007 West Oxfordshire District Council election took place on 3 May 2007 to elect members of West Oxfordshire District Council in Oxfordshire, England. One third of the council was up for election and the Conservative party stayed in overall control of the council.
The 2010 West Oxfordshire District Council election took place on 6 May 2010 to elect members of West Oxfordshire District Council in Oxfordshire, England. One third of the council was up for election and the Conservative party stayed in overall control of the council.
The 2011 West Oxfordshire District Council election took place on 5 May 2011 to elect members of West Oxfordshire District Council in Oxfordshire, England. One third of the council was up for election and the Conservative party stayed in overall control of the council.
The 2012 West Oxfordshire District Council election took place on 3 May 2012 to elect members of West Oxfordshire District Council in Oxfordshire, England. One third of the council was up for election and the Conservative party stayed in overall control of the council.
The 2014 West Oxfordshire District Council election took place on 22 May 2014 to elect members of West Oxfordshire District Council in Oxfordshire, England. One third of the council was up for election and the Conservative party stayed in overall control of the council.
The 2015 West Oxfordshire District Council election took place on 22 May 2015 to elect members of West Oxfordshire District Council in Oxfordshire, England. One third of the council was up for election and the Conservative party stayed in overall control of the council.
The 2011 South Oxfordshire District Council election was held on 5 May 2011 to elect members of South Oxfordshire District Council in England. This was on the same day as other local elections.