The full results for all counties are available here: Local Elections Handbook 1981 [1]
Party | Candidate | Votes | % | ± | |
---|---|---|---|---|---|
Liberal | Janet Ann Brown | 4,296 | |||
Conservative | J.D. Atkinson | 4,141 | |||
Labour | K.P. Evans | 2,069 | |||
Ecology | R. Cresswell | 179 | |||
Majority | 155 | ||||
Turnout | |||||
Liberal gain from Conservative | Swing | ||||
Party | Candidate | Votes | % | ± | |
---|---|---|---|---|---|
Liberal | P.M. McCarthy | 3,196 | |||
Labour | A.R. Gunter | 2,607 | |||
Conservative | G. Broadbent | 762 | |||
Communist | J.A. Light | 57 | |||
Majority | 589 | ||||
Turnout | |||||
Liberal hold | Swing | ||||
Party | Candidate | Votes | % | ± | |
---|---|---|---|---|---|
Labour | Dennis Burrill Mathews | 4,883 | |||
Conservative | William Birch | 1,616 | |||
Liberal | J.W. Ellis | 1,011 | |||
National Front | P.A. Spink | 97 | |||
Majority | 3,267 | ||||
Turnout | |||||
Labour hold | Swing | ||||
Party | Candidate | Votes | % | ± | |
---|---|---|---|---|---|
Liberal | Michael J. Meadowcroft | 3,043 | |||
Labour | F.H. Watson | 2,412 | |||
Conservative | L. Hargreaves | 691 | |||
Majority | 631 | ||||
Turnout | |||||
Liberal gain from Labour | Swing | ||||
Party | Candidate | Votes | % | ± | |
---|---|---|---|---|---|
Labour | Ken J. Patterson | 2,026 | |||
Liberal | David A. Gazey | 703 | |||
Conservative | H.B. Woodhead | 632 | |||
Majority | |||||
Turnout | |||||
Labour hold | Swing | ||||
Party | Candidate | Votes | % | ± | |
---|---|---|---|---|---|
Liberal | Margaret Grace Clay | 4,984 | |||
Labour | P.J. Kelly | 3,007 | |||
Conservative | K. Robinson | 600 | |||
National Front | B. Wadsworth | 72 | |||
Communist | M. Monkman | 102 | 0.8 | -0.3 | |
Majority | 1,977 | ||||
Turnout | |||||
Liberal gain from Labour | Swing | ||||
Party | Candidate | Votes | % | ± | |
---|---|---|---|---|---|
Labour | Robert Alexander Charles (aka Alec) Wilson | 4,028 | |||
Conservative | R.M. Barker | 3,642 | |||
Liberal | T.W.J. Garbett | 1,106 | |||
Ecology | H.J. Terry | 163 | |||
Communist | Lynette Willoughby | 78 | |||
Majority | 386 | ||||
Turnout | |||||
Labour gain from Conservative | Swing | ||||
Party | Candidate | Votes | % | ± | |
---|---|---|---|---|---|
Labour | Irene Ruby Levy | 2,346 | |||
Conservative | R. Simpson | 657 | |||
Liberal | Elizabeth Bee | 751 | |||
Ecology | Roger D Boyle | 175 | |||
Communist | J.M. Rodgers | 148 | |||
Majority | 1,595 | ||||
Turnout | |||||
Labour hold | Swing | ||||
Party | Candidate | Votes | % | ± | |
---|---|---|---|---|---|
Conservative | Adrian J.A. Lodge | 5,346 | |||
Labour | C. Burgon | 2,484 | |||
Liberal | Margaret Gardham | 2,032 | |||
Ecology | Claire Nash | 313 | |||
Majority | 2,826 | ||||
Turnout | |||||
Conservative hold | Swing | ||||
Party | Candidate | Votes | % | ± | |
---|---|---|---|---|---|
Conservative | John Tweddle | 3,813 | |||
Labour | L. Graham | 2,891 | |||
Liberal | B. Hutchinson | 827 | |||
Ecology | D.T. Corry | 338 | |||
Majority | 922 | ||||
Turnout | |||||
Conservative hold | Swing | ||||
Party | Candidate | Votes | % | ± | |
---|---|---|---|---|---|
Labour | J.D. Moynihan | 5,188 | |||
Conservative | J.C. Suttenstall | 1,521 | |||
Liberal | N.R. Mackie | 863 | |||
Majority | 3,667 | ||||
Turnout | |||||
Labour hold | Swing | ||||
Party | Candidate | Votes | % | ± | |
---|---|---|---|---|---|
Conservative | W.K. Hedley | 3,149 | |||
Labour | Annie Margaret McQueenie | 2,050 | |||
Liberal | Keith Cecil Norman | 869 | |||
Majority | 1,099 | ||||
Turnout | |||||
Conservative hold | Swing | ||||
Party | Candidate | Votes | % | ± | |
---|---|---|---|---|---|
Labour | Maisie Maria Edge | 3,631 | |||
Conservative | Gilbert R. Lax | 3,491 | |||
Liberal | Patricia Jean Arnold | 1,078 | |||
Ecology | Penelope Jane Sanders | 219 | |||
Majority | 140 | ||||
Turnout | |||||
Labour gain from Conservative | Swing | ||||
Party | Candidate | Votes | % | ± | |
---|---|---|---|---|---|
Labour | Harold Best | 2,828 | |||
Conservative | Alan Sydney Pedley | 2,007 | |||
Liberal | M.J. Hipshon | 890 | |||
Ecology | Christine Rushworth | 214 | |||
Communist | Barry Cooper | 139 | |||
Majority | 821 | ||||
Turnout | |||||
Labour gain from Conservative | Swing | ||||
Party | Candidate | Votes | % | ± | |
---|---|---|---|---|---|
Liberal | J.P. Hopkinson | 3,275 | |||
Conservative | L.W. Robinson | 2,341 | |||
Labour | E. Barlow | 1,131 | |||
Ecology | R. Price | 147 | |||
Majority | 934 | ||||
Turnout | |||||
Liberal gain from Conservative | Swing | ||||
Party | Candidate | Votes | % | ± | |
---|---|---|---|---|---|
Labour | John Gunnell | 5,057 | |||
Liberal | M. Day | 1,066 | |||
Conservative | T.R. Davies | 449 | |||
National Front | E. Morrison | 72 | |||
Majority | 3,991 | ||||
Turnout | |||||
Labour hold | Swing | ||||
Party | Candidate | Votes | % | ± | |
---|---|---|---|---|---|
Labour | N. Cooper | 3,985 | |||
Conservative | A.C. Taylor | 1,289 | |||
Liberal | Diane Philipa Hadwin | 613 | |||
Majority | 2,696 | ||||
Turnout | |||||
Labour hold | Swing | ||||
Party | Candidate | Votes | % | ± | |
---|---|---|---|---|---|
Labour | Brian Selby | 2,997 | |||
Conservative | Albert A. Walkington | 1,443 | |||
Liberal | J. Ackrill | 523 | |||
Majority | 1,554 | ||||
Turnout | |||||
Labour hold | Swing | ||||
Party | Candidate | Votes | % | ± | |
---|---|---|---|---|---|
Labour | St John Binns | 3,405 | |||
Conservative | Anthony J. Larvin | 434 | |||
Liberal | Shirley Ward | 534 | |||
Majority | 2,871 | ||||
Turnout | |||||
Labour hold | Swing | ||||
Party | Candidate | Votes | % | ± | |
---|---|---|---|---|---|
Conservative | Kenneth T Davison | 2,166 | |||
Labour | D.M. Winter | 1,583 | |||
Liberal | Rosemary Judith Clay | 696 | |||
Ecology | K.M. Rushworth | 170 | |||
Majority | 583 | ||||
Turnout | |||||
Conservative hold | Swing | ||||
Party | Candidate | Votes | % | ± | |
---|---|---|---|---|---|
Labour | Linda Rose Middleton | 3,388 | |||
Conservative | G. Rogerson | 2,784 | |||
Liberal | Anne Kathryn Gilchrist | 818 | |||
Majority | 604 | ||||
Turnout | |||||
Labour gain from Conservative | Swing | ||||
Party | Candidate | Votes | % | ± | |
---|---|---|---|---|---|
Labour | R. Darrington | 4,019 | |||
Conservative | S.D. Hodgson | 1,423 | |||
Liberal | Marrion Elisa Hirst | 631 | |||
Majority | 2,596 | ||||
Turnout | |||||
Labour hold | Swing | ||||
Party | Candidate | Votes | % | ± | |
---|---|---|---|---|---|
Labour | John M. Sully | 2,909 | |||
Conservative | Jean Higham | 709 | |||
Liberal | Anne Weatherley | 619 | |||
Majority | 2,200 | ||||
Turnout | |||||
Labour hold | Swing | ||||
Party | Candidate | Votes | % | ± | |
---|---|---|---|---|---|
Liberal | Barry Peters | 4,052 | |||
Conservative | C.J. Fox | 3,112 | |||
Labour | Audrey Joyce Slee | 841 | |||
Ecology | A. Marriot | 215 | |||
Social Democratic | G.J. Malcolm | 109 | |||
Majority | 940 | ||||
Turnout | |||||
Liberal gain from Conservative | Swing | ||||
Party | Candidate | Votes | % | ± | |
---|---|---|---|---|---|
Conservative | Harry Gill | 2,743 | |||
Labour | Neil G. Rhodes | 2,602 | |||
Liberal | A.R. Booker | 1,332 | |||
Ecology | N. A. Strudwick | 123 | |||
Majority | 141 | ||||
Turnout | |||||
Conservative hold | Swing | ||||
Party | Candidate | Votes | % | ± | |
---|---|---|---|---|---|
Labour | Andrew R Jarosz | 2,111 | |||
Conservative | C. Critchley | 2,014 | |||
Liberal | D.N. Collins | 1,879 | 39.0 | +3.1 | |
Majority | 97 | ||||
Turnout | |||||
Labour hold | Swing | ||||
Party | Candidate | Votes | % | ± | |
---|---|---|---|---|---|
Labour | W. H. Banks | 4,874 | |||
Conservative | D. Boynton | 1,665 | |||
Liberal | R.C James | 1,168 | |||
Communist | R Horsbrough | 90 | |||
Majority | 3,209 | ||||
Turnout | |||||
Labour hold | Swing | ||||
Party | Candidate | Votes | % | ± | |
---|---|---|---|---|---|
Labour | Len Hodgson | 3,450 | |||
Conservative | J.M. Suttenstall | 688 | |||
Communist | B.S. Wilson | 91 | |||
Majority | 2,762 | ||||
Turnout | |||||
Labour hold | Swing | ||||
Party | Candidate | Votes | % | ± | |
---|---|---|---|---|---|
Labour | Margaret Sarah Cliff | 2,763 | |||
Conservative | A. Holmes | 906 | |||
Liberal | S. J. Gillien | 863 | |||
Majority | 1,857 | ||||
Turnout | |||||
Labour hold | Swing | ||||
Party | Candidate | Votes | % | ± | |
---|---|---|---|---|---|
Conservative | J. Bird | 2,622 | |||
Liberal | G. Macpherson | 1,128 | |||
Labour | J. W. Hall | 1,059 | |||
Majority | 1,494 | ||||
Turnout | |||||
Conservative hold | Swing | ||||
Party | Candidate | Votes | % | ± | |
---|---|---|---|---|---|
Conservative | Yvonne Brenda Garden | 5,504 | |||
Labour | I. K. Adams | 1,233 | |||
Liberal | June Cutliffe Scott | 942 | |||
Ecology | D. Rawson | 482 | |||
Majority | 4,271 | ||||
Turnout | |||||
Conservative hold | Swing | ||||
Party | Candidate | Votes | % | ± | |
---|---|---|---|---|---|
Labour | C. Webster | 2,499 | |||
Conservative | F. Stubley | 1,589 | |||
Liberal | W.T. Moss | 1,536 | |||
Majority | 910 | ||||
Turnout | |||||
Labour gain from Conservative | Swing | ||||
Party | Candidate | Votes | % | ± | |
---|---|---|---|---|---|
Liberal | Margaret Jones | ||||
Labour | |||||
Conservative | |||||
Majority | 247 | ||||
Turnout | |||||
Liberal hold | Swing | ||||
Party | Candidate | Votes | % | ± | |
---|---|---|---|---|---|
Labour | Marie Stinson | ||||
Conservative | |||||
SDP–Liberal Alliance | |||||
Ecology | |||||
Majority | |||||
Turnout | |||||
Labour hold | Swing | ||||
Michael Thrasher is a British academic, Professor of Politics in the School of Sociology, Politics & Law at the University of Plymouth. He is also Sky News' election analyst.
Local elections took place in much of the United Kingdom on 6 May 1999. All Scottish and Welsh unitary authorities had all their seats elected. In England a third of the seats on each of the Metropolitan Boroughs were elected along with elections in many of the unitary authorities and district councils. There were no local elections in Northern Ireland.
Dorset County Council is elected every four years by the first past the post system of election. The council currently consists of 46 councillors, representing 40 electoral divisions. The Conservative Party is currently the largest party on the council, having gained overall control in the 2001 local elections. The council meets at County Hall in Dorchester, on the site of Colliton Park adjacent to a Roman Town House.
Elections to Tower Hamlets London Borough Council were held on 5 May 1994. The whole council was up for election and the Labour party gained overall control of the council from the Liberal Democrats.
Elections to Southwark Council were held in May 1994. The whole council was up for election. Turnout was 36.5%.
Elections to Lambeth London Borough Council were held in May 1994. Turnout was 42.7%.
Elections to Lewisham London Borough Council were held in May 1994. The whole council was up for election.
Elections to Newham London Borough Council were held in May 1994. Turnout was 37.2%.
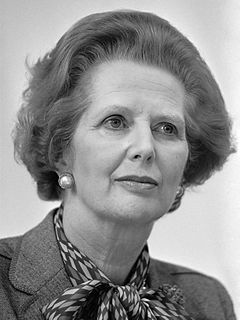
Local elections were held in the United Kingdom on 3 May 1990. They were the last local elections held before the resignation of Prime Minister Margaret Thatcher in November 1990.
Local elections were held in the United Kingdom in May 1981. The results were a mid-term setback for the Conservative government, which lost 1,193 seats, leaving them with 10,545 councillors. The projected share of the vote was more respectable for the government, however: Labour 41%, Conservatives 38%, Liberals 17%. This was in spite of opinion polls showing a much wider Labour lead over the Conservatives. These were the first elections to be contested by Labour under the leadership of Michael Foot, who had succeeded James Callaghan in late 1980.
Local elections were held in the United Kingdom in 1983. The results were a success for Conservative Prime Minister Margaret Thatcher, who soon afterwards called a general election in which the Conservatives won a landslide victory. The projected share of the vote was Conservative 39%, Labour Party 36%, Liberal-SDP Alliance 20%.
Local elections were held in the United Kingdom in 1985. The projected share of the vote was Labour 39%, Conservative 32%, Liberal-SDP Alliance 26%. Labour had the largest share of the vote in local council elections for the first time since 1981.
Local elections were held in the United Kingdom in 1986. There was a 3% reduction in the number of councillors, owing to the abolition of the Greater London Council and the Metropolitan County Councils.
Local elections were held in the United Kingdom in 1987. The projected share of the vote was Conservatives 38%, Labour 32%, Liberal-SDP Alliance 27%. It was the first time since 1983 that the Conservatives had enjoyed the largest share of the vote in local council elections.
Local elections were held in the United Kingdom in 1988. The Conservative government held its ground and remained ahead in the projected popular vote.
The 1994 York City Council elections took place in May 1994 to elect the members of York City Council in North Yorkshire, England. These were the final elections to York City Council. Fifteen seats, previously contested in 1990, were up for election: twelve were won by the Labour Party, two by the Liberal Democrats and one by the Conservative Party.
The 2006 Stockport Metropolitan Borough Council election took place on 4 May 2006 to elect members of Stockport Metropolitan Borough Council in England. This was on the same day as other local elections. One third of the council was up for election, with each successful candidate serving a four-year term of office, expiring in 2010. The Liberal Democrats held overall control of the council.
The 2004 Stockport Metropolitan Borough Council election took place on 10 June 2004 to elect members of Stockport Metropolitan Borough Council in England. This was on the same day as other local elections. Due to demographic changes in the Borough since its formation in 1973, and in common with most other English Councils in 2004, boundary changes were implemented in time for these elections. Due to these changes, it was necessary for the whole Council to be re-elected for the first time since 1973. The Liberal Democrats held overall control of the council.
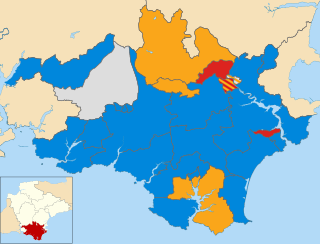
Elections to South Hams District Council took place on 1 May 2003, the same day as other United Kingdom local elections The whole council was up for election and Conservative Party retained overall control of the council.
Elections to South Hams District Council took place on 3 May 2007, the same day as other United Kingdom local elections The whole council was up for election and Conservative Party retained overall control of the council.