The 2014 Weymouth and Portland Borough Council election took place on 22 May 2014 to elect members of Weymouth and Portland Borough Council in England. [1] This was on the same day as other local elections.
The elections saw the Labour Party gain 3 seats and become the largest party on the council with 15 seats, but without an overall majority. The Conservative Party was reduced to 11 seats compared to the 14 they had after the 2012 election.
After the election, the composition of the council was
The Labour Party is a centre-left political party in the United Kingdom that has been described as an alliance of social democrats, democratic socialists and trade unionists. The party's platform emphasises greater state intervention, social justice and strengthening workers' rights.
The Conservative Party, officially the Conservative and Unionist Party, is a centre-right political party in the United Kingdom. The governing party since 2010, it is the largest in the House of Commons, with 313 Members of Parliament, and also has 249 members of the House of Lords, 18 members of the European Parliament, 31 Members of the Scottish Parliament, 12 members of the Welsh Assembly, eight members of the London Assembly and 8,916 local councillors.
The Liberal Democrats are a liberal political party in the United Kingdom. It is currently led by Vince Cable. They have 11 Members of Parliament in the House of Commons, 96 members of the House of Lords, one member of the European Parliament, five Members of the Scottish Parliament and one member in the Welsh Assembly and London Assembly. At the height of its influence, the party formed a coalition government with the Conservative Party from 2010 to 2015 with its leader Nick Clegg serving as Deputy Prime Minister.
Party | Seats | Gains | Losses | Net gain/loss | Seats % | Votes % | Votes | +/− | |
---|---|---|---|---|---|---|---|---|---|
Labour | 5 | 3 | 0 | +3 | 41.7 | 29.6 | 4,485 | ||
Conservative | 4 | 0 | 3 | -3 | 33.3 | 27.7 | 4,209 | ||
Liberal Democrat | 1 | 0 | 1 | -1 | 8.3 | 14.3 | 2,171 | ||
UKIP | 1 | 1 | 0 | +1 | 8.3 | 12.4 | 1,888 | ||
Independent | 1 | 0 | 0 | 0 | 8.3 | 3.4 | 516 | ||
Green | 0 | 0 | 0 | 0 | 0.0 | 12.5 | 1,902 | ||
Gain/loss is relative to the 2010 results.
The following councillors were elected in 2010 and had to seek re-election.
Ward | Councillor | Party |
---|---|---|
Littlemoor | Mark Tewkesbury | Labour |
Melcombe Regis | Raymond Banham | Liberal Democrat |
Preston | Hazel Bruce | Conservative |
Tophill East | Margaret Leicester | Independent |
Tophill West | Ian Munro-Price | Conservative |
Underhill | Paul Kimber | Labour |
Upwey and Broadwey | Robert Dunster | Conservative |
Westham East | Ian James | Conservative |
Westham North | Christine James | Liberal Democrat |
Wey Valley | Kevin Hodder | Conservative |
Weymouth West | Dominic Lonsdale | Conservative |
Wyke Regis | Geoffrey Petherick | Independent (elected as Conservative) |
No elections: Radipole, Westham West, Weymouth East
Geoff Petherick became an independent in May 2011. [2]
Party | Candidate | Votes | % | ± | |
---|---|---|---|---|---|
Labour | Mark Tewkesbury | 474 | 56.2 | ||
UKIP | Sandra Cobb | 224 | 26.5 | ||
Conservative | John Ellis | 146 | 17.3 | ||
Majority | 250 | ||||
Turnout | 32.64 | ||||
Labour hold | Swing | ||||
Party | Candidate | Votes | % | ± | |
---|---|---|---|---|---|
UKIP | Francis Drake | 312 | 24.8 | ||
Conservative | Roger Costello | 297 | 23.6 | ||
Labour | Dan Brember | 268 | 21.3 | ||
Liberal Democrat | Ray Banham | 250 | 19.9 | ||
Green | Jonathan Orrell | 131 | 10.4 | ||
Majority | 15 | ||||
Turnout | 27.32 | ||||
UKIP gain from Liberal Democrat | Swing | ||||
Party | Candidate | Votes | % | ± | |
---|---|---|---|---|---|
Conservative | Hazel Bruce | 918 | 38.2 | ||
Liberal Democrat | Howard Legg | 570 | 23.7 | ||
UKIP | Steve Cobb | 530 | 22.1 | ||
Labour | Maureen Drake | 260 | 10.8 | ||
Green | John Tomblin | 124 | 5.2 | ||
Majority | 348 | ||||
Turnout | 55.46 | ||||
Conservative hold | Swing | ||||
Party | Candidate | Votes | % | ± | |
---|---|---|---|---|---|
Independent | Margaret Leicester | 253 | 27.8 | ||
UKIP | Alan Ackroyd | 225 | 24.7 | ||
Labour | Jim Draper | 209 | 23.0 | ||
Conservative | Richard Paisley | 169 | 18.6 | ||
Green | Benn Harrison | 54 | 5.9 | ||
Majority | 28 | ||||
Turnout | 36.87 | ||||
Independent hold | Swing | ||||
Party | Candidate | Votes | % | ± | |
---|---|---|---|---|---|
Labour | Penny McCartney | 426 | 33.2 | ||
Conservative | Alec Nicholls | 346 | 26.9 | ||
Liberal Democrat | Sue Lees | 268 | 20.9 | ||
Green | Susan Sutton | 245 | 19.1 | ||
Majority | 80 | ||||
Turnout | 34.26 | ||||
Labour gain from Conservative | Swing | ||||
Party | Candidate | Votes | % | ± | |
---|---|---|---|---|---|
Labour | Paul Kimber | 473 | 59.7 | ||
UKIP | Tracey Gough | 319 | 40.3 | ||
Majority | 154 | ||||
Turnout | 30.12 | ||||
Labour hold | Swing | ||||
Party | Candidate | Votes | % | ± | |
---|---|---|---|---|---|
Conservative | Kevin Brookes | 406 | 34.4 | ||
Labour | Kieron Womble | 364 | 30.8 | ||
UKIP | John Morse | 278 | 23.5 | ||
Green | David Smith | 133 | 11.3 | ||
Majority | 42 | ||||
Turnout | 41.25 | ||||
Conservative hold | Swing | ||||
Party | Candidate | Votes | % | ± | |
---|---|---|---|---|---|
Labour | Gareth Rockingham | 367 | 42.2 | ||
Liberal Democrat | Oz Kanji | 275 | 31.6 | ||
Conservative | Jean Woodward | 228 | 26.2 | ||
Majority | 92 | ||||
Turnout | 32.43 | ||||
Labour gain from Conservative | Swing | ||||
Party | Candidate | Votes | % | ± | |
---|---|---|---|---|---|
Liberal Democrat | Christine James | 808 | 59.2 | ||
Labour | Pete Barrow | 558 | 40.8 | ||
Majority | 250 | ||||
Turnout | 34.27 | ||||
Liberal Democrat hold | Swing | ||||
Party | Candidate | Votes | % | ± | |
---|---|---|---|---|---|
Conservative | Cory Russell | 630 | 54.6 | ||
Green | Brian Heatley | 523 | 45.4 | ||
Majority | 107 | ||||
Turnout | 40.54 | ||||
Conservative hold | Swing | ||||
Party | Candidate | Votes | % | ± | |
---|---|---|---|---|---|
Conservative | Claudia Webb | 541 | 34.2 | ||
Labour | Tashi Warr | 536 | 33.9 | ||
Green | Claire Sutton | 504 | 31.9 | ||
Majority | 5 | ||||
Turnout | 40.90 | ||||
Conservative hold | Swing | ||||
Party | Candidate | Votes | % | ± | |
---|---|---|---|---|---|
Labour | Craig Martin | 550 | 36.0 | ||
Conservative | Christopher Mallen | 528 | 34.5 | ||
Independent | Mark Griffiths | 263 | 17.2 | ||
Green | Leslie Dalton | 188 | 12.3 | ||
Majority | 22 | ||||
Turnout | 35.94 | ||||
Labour gain from Conservative | Swing | ||||
One-third of Weymouth and Portland District Council in Dorset, England, is elected each year, followed by one year where there is an election to Dorset County Council instead.
Elections to Weymouth and Portland Borough Council in Dorset, England were held on 1 May 2008. One third of the council was up for election and the council stayed under no overall control as it has been since 1980.
The 2010 Weymouth and Portland Borough Council election took place on 6 May 2010 to elect members of Weymouth and Portland Borough Council in Dorset, England. One third of the council was up for election and the council stayed under no overall control.
The 2010 Enfield Council election took place on 6 May 2010 to elect members of Enfield London Borough Council in London, England. The whole council was up for election and the Labour party gained overall control of the council from the Conservative party.
Local elections were held in the United Kingdom in 1980. These were the first annual local elections for the new Conservative Prime Minister Margaret Thatcher. Though the Conservatives in government lost seats, the projected share of the vote was close: Labour Party 42%, Conservative Party 40%, Liberal Party 13%. Labour were still being led by the former prime minister James Callaghan, who resigned later in the year to be succeeded by Michael Foot.
The 1999 Solihull Metropolitan Borough Council election took place on 6 May 1999 to elect members of Solihull Metropolitan Borough Council in the West Midlands, England. One third of the council was up for election and the council stayed under no overall control.
The 2010 Pendle Borough Council election took place on 6 May 2010 to elect members of Pendle Borough Council in Lancashire, England. One third of the council was up for election and the council stayed under no overall control.
The 2010 Barrow-in-Furness Borough Council election took place on 6 May 2010 to elect members of Barrow-in-Furness Borough Council in Cumbria, England. One third of the council was up for election and the council stayed under no overall control.
The 2007 Basingstoke and Deane Council election took place on 3 May 2007 to elect members of Basingstoke and Deane Borough Council in Hampshire, England. One third of the council was up for election and the Conservative party stayed in overall control of the council.
The 2011 Copeland Borough Council election took place on 5 May 2011 to elect members of Copeland Borough Council in Cumbria, England. The whole council was up for election and the Labour party stayed in overall control of the council.
The 2011 Swindon Borough Council election took place on 5 May 2011 to elect members of Swindon Unitary Council in Wiltshire, England. One third of the council was up for election and the Conservative party stayed in overall control of the council.
The 2007 Redcar and Cleveland Borough Council election took place on 3 May 2007 to elect members of Redcar and Cleveland Unitary Council in England. The whole council was up for election and the council stayed under no overall control.
The 2014 Basingstoke and Deane Borough Council election took place on 22 May 2014 to elect members of Basingstoke and Deane Borough Council in England. This was on the same day as other local elections.
The 2012 Pendle Borough Council election took place on 3 May 2012 to elect members of Pendle Borough Council in Lancashire, England. One third of the council was up for election and the council stayed under no overall control.
The 2007 Castle Point Borough Council election took place on 3 May 2007 to elect members of Castle Point Borough Council in Essex, England. One third of the council was up for election and the Conservative party stayed in overall control of the council.
The 2010 Brent London Borough Council election took place on 6 May 2010 to elect members of Brent London Borough Council in London, England. The whole council was up for election and the Labour party gained overall control of the council from no overall control.
The 2010 Swale Borough Council election took place on 6 May 2010 to elect members of Swale Borough Council in Kent, England. One third of the council was up for election and the Conservative party stayed in overall control of the council.
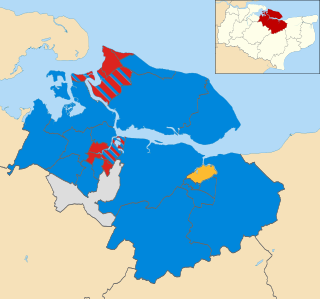
The 2011 Swale Borough Council election took place on 5 May 2011 to elect members of Swale Borough Council in Kent, England. The whole council was up for election and the Conservative party stayed in overall control of the council.
The 2015 Weymouth and Portland Borough Council election took place on 7 May 2015 to elect 12 members of Weymouth and Portland Borough Council in England. This was on the same day as the 2015 general election.
The 2016 Weymouth and Portland Borough Council election took place on 5 May 2016 to elect members of Weymouth and Portland Borough Council in England. This was on the same day as other local elections.