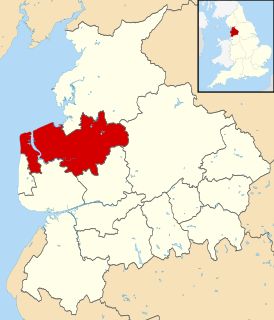
Elections to Wyre Borough Council were held on 5 May 2003. All 55 councillors were elected from 26 wards in elections held every four years. The Conservative Party kept hold overall control of the council. [1] For this election boundary changes had taken place which resulted in reducing the number of seats by one.
Wyre is a local government district with borough status in Lancashire, England. The population of the non-metropolitan district at the 2011 census was 107,749. The district borders the unitary authority of Blackpool as well as the districts of Lancaster, Ribble Valley, Fylde and Preston. The council is based in Poulton-le-Fylde.
The Conservative Party, officially the Conservative and Unionist Party, is a centre-right political party in the United Kingdom. Presently led by Theresa May, it has been the governing party since 2010. It presently has 314 Members of Parliament in the House of Commons, 249 members of the House of Lords, and 18 members of the European Parliament. It also has 31 Members of the Scottish Parliament, 12 members of the Welsh Assembly, eight members of the London Assembly and 9,008 local councillors. One of the major parties of UK politics, it has formed the government on 45 occasions, more than any other party.
After the election composition of the council was as follows:
Party | Seats | ± | |
---|---|---|---|
Conservative | 33 | -2 | |
Labour | 21 | +2 | |
Liberal Democrat | 1 | -1 | |
Party | Seats | Gains | Losses | Net gain/loss | Seats % | Votes % | Votes | +/− | |
---|---|---|---|---|---|---|---|---|---|
Conservative | 33 | -12 | 60.00 | 50.09 | 15,648 | ||||
Labour | 21 | +2 | 38.18 | 38.51 | 12,031 | ||||
Liberal Democrat | 1 | -1 | 1.82 | 9.00 | 2,813 | ||||
Independent | 0 | 0 | 0 | 0 | 0.00 | 2.40 | 750 |
Party | Candidate | Votes | % | ± | |
---|---|---|---|---|---|
Labour | Terence Lees | 692 | 26.43 | ||
Labour | Anne Hall | 667 | 25.48 | ||
Labour | John Condron | 659 | 25.17 | ||
Conservative | Corinne Roberts | 600 | 22.92 | ||
Turnout |
Party | Candidate | Votes | % | ± | |
---|---|---|---|---|---|
Conservative | Harry Taylor | 669 | 36.34 | ||
Conservative | Francis Carroll | 646 | 35.09 | ||
Labour | Alan Dawkins | 276 | 14.99 | ||
Labour | Peter Elliott | 250 | 13.58 | ||
Turnout |
Party | Candidate | Votes | % | ± | |
---|---|---|---|---|---|
Conservative | Pete Murphy | 425 | 69.44 | ||
Liberal Democrat | David Thompson | 187 | 30.56 | ||
Majority | 238 | 38.89 | |||
Turnout | 612 |
Party | Candidate | Votes | % | ± | |
---|---|---|---|---|---|
Conservative | Roger Brooks | 364 | 54.74 | ||
Labour | Marilyn Levey | 301 | 45.26 | ||
Majority | 63 | 9.47 | |||
Turnout | 665 |
Party | Candidate | Votes | % | ± | |
---|---|---|---|---|---|
Conservative | David Williams | 292 | 52.24 | ||
Liberal Democrat | Jack Rogers | 267 | 47.76 | ||
Majority | 25 | 4.47 | |||
Turnout | 559 |
Party | Candidate | Votes | % | ± | |
---|---|---|---|---|---|
Conservative | James Hargeaves | 677 | 28.99 | ||
Conservative | Frances Gandhi | 669 | 28.65 | ||
Labour | Jane Jackson | 511 | 21.88 | ||
Labour | Andrew Walker | 478 | 20.47 | ||
Turnout |
Party | Candidate | Votes | % | ± | |
---|---|---|---|---|---|
Liberal Democrat | David Sharples | 532 | 68.91 | ||
Conservative | Valerie Wilson | 240 | 31.09 | ||
Majority | 292 | 37.82 | |||
Turnout | 772 |
Party | Candidate | Votes | % | ± | |
---|---|---|---|---|---|
Labour | Penelope Martin | 862 | 17.06 | ||
Labour | Wayne Martin | 854 | 16.90 | ||
Labour | John Traynor | 852 | 16.86 | ||
Conservative | Arthur Brooks | 750 | 14.84 | ||
Conservative | William Rogerson | 730 | 14.45 | ||
Conservative | Ernest Smith | 693 | 13.71 | ||
Liberal Democrat | Jean Taylor | 312 | 6.17 | ||
Turnout |
Party | Candidate | Votes | % | ± | |
---|---|---|---|---|---|
Conservative | Dulcie Atkins | 1,066 | 23.03 | ||
Conservative | Elizabeth Collinson | 923 | 19.94 | ||
Conservative | Thomas Balmain | 912 | 19.70 | ||
Liberal Democrat | Paul Harrison | 693 | 14.97 | ||
Liberal Democrat | Francis Purkins | 590 | 12.75 | ||
Labour | Stanley Harvey | 445 | 9.61 | ||
Turnout |
Party | Candidate | Votes | % | ± | |
---|---|---|---|---|---|
Conservative | Alfred Coop | 815 | 46.95 | ||
Conservative | Thomas Pimbley | 688 | 39.63 | ||
Labour | David Swift | 233 | 13.42 | ||
Turnout |
Party | Candidate | Votes | % | ± | |
---|---|---|---|---|---|
Conservative | John Dickinson | 878 | 31.11 | ||
Conservative | Lynn Bowen | 797 | 28.24 | ||
Labour | Roger Cameron | 599 | 21.23 | ||
Labour | Margaret Jackson | 548 | 19.42 | ||
Turnout |
Party | Candidate | Votes | % | ± | |
---|---|---|---|---|---|
Conservative | Graeme Cocker | 787 | 36.28 | ||
Conservative | Frank Turner | 730 | 33.66 | ||
Labour | Richard Barnes | 336 | 15.49 | ||
Labour | Eileen Pacey-Patrick | 316 | 14.57 | ||
Turnout |
Party | Candidate | Votes | % | ± | |
---|---|---|---|---|---|
Conservative | Maurice Richardson | 787 | 30.16 | ||
Conservative | Daniel Penswick | 752 | 28.82 | ||
Labour | Alphonse Robert | 553 | 21.20 | ||
Labour | Eric Stafford | 517 | 19.82 | ||
Turnout |
Party | Candidate | Votes | % | ± | |
---|---|---|---|---|---|
Conservative | Alan Heppenstall | 530 | 26.33 | ||
Conservative | John Hodgkinson | 501 | 24.89 | ||
Labour | Kathleen Condron | 499 | 24.79 | ||
Labour | Graham Robinson | 483 | 23.99 | ||
Turnout |
Party | Candidate | Votes | % | ± | |
---|---|---|---|---|---|
Labour | Ian Duffy | 596 | 29.93 | ||
Labour | Ruth Duffy | 572 | 28.73 | ||
Conservative | Mark Hamer | 456 | 22.90 | ||
Conservative | Carole Bonham | 367 | 18.43 | ||
Turnout |
Party | Candidate | Votes | % | ± | |
---|---|---|---|---|---|
Labour | David Twizell | 503 | 26.46 | ||
Labour | Peter Smith | 477 | 25.09 | ||
Conservative | John Shedwick | 470 | 24.72 | ||
Conservative | Leonard Jolley | 451 | 23.72 | ||
Turnout |
Party | Candidate | Votes | % | ± | |
---|---|---|---|---|---|
Labour | Stanley Leadbetter | 673 | 38.04 | ||
Labour | Geoffrey Horrocks | 603 | 34.09 | ||
Conservative | Kathleen Vincent | 261 | 14.75 | ||
Conservative | Catherine Rogerson | 232 | 13.11 | ||
Turnout |
Party | Candidate | Votes | % | ± | |
---|---|---|---|---|---|
Labour | Lorraine Beavers | 946 | 26.20 | ||
Labour | Clive Grunshaw | 927 | 25.67 | ||
Labour | Ronald Shewan | 905 | 25.06 | ||
Conservative | Margaret Grant | 249 | 6.90 | ||
Conservative | Graham Cooke | 206 | 5.70 | ||
Conservative | Michael Vincent | 195 | 5.40 | ||
Liberal Democrat | Kenneth Palmerton | 183 | 5.07 | ||
Turnout |
Party | Candidate | Votes | % | ± | |
---|---|---|---|---|---|
Conservative | Donald Lawrenson | 342 | 52.13 | ||
Liberal Democrat | Neil Thompson | 314 | 47.87 | ||
Majority | 28 | 4.27 | |||
Turnout | 656 |
Party | Candidate | Votes | % | ± | |
---|---|---|---|---|---|
Conservative | Ian McCann | 1,012 | 22.28 | ||
Conservative | Paul Moon | 936 | 20.60 | ||
Conservative | Vivien Taylor | 935 | 20.58 | ||
Independent | Thomas Hudson | 750 | 16.51 | ||
Labour | Nicholas Fogg | 498 | 10.96 | ||
Labour | Brian Stephenson | 412 | 9.07 | ||
Turnout |
Party | Candidate | Votes | % | ± | |
---|---|---|---|---|---|
Labour | Marlene Colby | 953 | 22.71 | ||
Labour | Vincent Riley | 950 | 22.64 | ||
Labour | Edwn Taylor | 886 | 21.11 | ||
Conservative | Harry King | 486 | 11.58 | ||
Conservative | Frances Thewlis | 463 | 11.03 | ||
Conservative | Kathleen Walker | 459 | 10.94 | ||
Turnout |
Party | Candidate | Votes | % | ± | |
---|---|---|---|---|---|
Conservative | William Forsyth | 941 | 18.97 | ||
Conservative | Ralph Lawrenson | 934 | 18.83 | ||
Conservative | Ramesh Gandhi | 931 | 18.77 | ||
Labour | Thomas Rawlings | 736 | 14.84 | ||
Labour | David Oxley | 712 | 14.35 | ||
Labour | Richard Anyon | 707 | 14.25 | ||
Turnout |
Party | Candidate | Votes | % | ± | |
---|---|---|---|---|---|
Conservative | David Bannister | 781 | 35.40 | ||
Conservative | Peter Hawley | 752 | 34.09 | ||
Labour | Alan Morgan | 341 | 15.46 | ||
Labour | Christopher Frost | 332 | 15.05 | ||
Turnout |
Party | Candidate | Votes | % | ± | |
---|---|---|---|---|---|
Conservative | Keith Tebbs | 839 | 20.30 | ||
Conservative | Rita Amos | 828 | 20.03 | ||
Conservative | Alan Vincent | 779 | 18.85 | ||
Labour | Fred Greenhalgh | 615 | 14.88 | ||
Labour | Christopher Brooks | 545 | 13.19 | ||
Labour | Paul Meehan | 527 | 12.75 | ||
Turnout |
Party | Candidate | Votes | % | ± | |
---|---|---|---|---|---|
Labour | Margaret Anderton | 863 | 21.26 | ||
Labour | Irene Robinson | 821 | 20.22 | ||
Labour | George Irish | 777 | 19.14 | ||
Conservative | Andrea Whitehouse | 562 | 13.84 | ||
Conservative | Roger Berry | 546 | 13.45 | ||
Conservative | William Proctor | 491 | 12.09 | ||
Turnout |
Party | Candidate | Votes | % | ± | |
---|---|---|---|---|---|
Conservative | Richard Collinson | 369 | 53.17 | ||
Liberal Democrat | Hazel Ronson | 325 | 46.83 | ||
Majority | 44 | 6.34 | |||
Turnout | 694 |
The Borough of Fylde is a local government district with borough status in Lancashire, England. It covers part of the Fylde plain, after which it is named. The council's headquarters are in St Annes. Some council departments, including Planning and an office of the Registrar, were previously located in Wesham, but in 2007 these offices were transferred to the ownership of the NHS North Lancashire Primary Care Trust and have since been replaced by a new housing development. The population of the Non-metropolitan district at the 2011 census was 75,757.
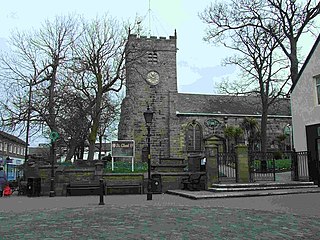
Poulton-le-Fylde, commonly abbreviated to Poulton, is a market town in Lancashire, England, situated on the coastal plain called the Fylde. In the 2001 United Kingdom census, it had a population of 18,264. There is evidence of human habitation in the area from 12,000 years ago and several archaeological finds from Roman settlement in England have been found in the area. At the time of the Norman conquest Poulton was a small agricultural settlement in the hundred of Amounderness. The church of St Chad was recorded in 1094 when it was endowed to Lancaster Priory. By the post-Medieval period the town had become an important commercial centre for the region with weekly and triannual markets. Goods were imported and exported through two harbours on the River Wyre. In 1837, the town was described as the "metropolis of the Fylde", but its commercial importance waned from the mid-19th century with the development of the nearby coastal towns of Fleetwood and Blackpool.
Fylde is a Lancashire constituency represented in the House of Commons of the UK Parliament since 2010 by Mark Menzies, a Conservative.
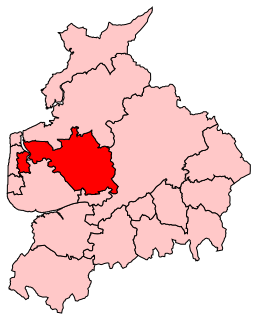
Wyre and Preston North is a county constituency represented in the House of Commons of the Parliament of the United Kingdom. Created in the most recent fifth periodic review of constituencies by the Boundary Commission for England, it elects one Member of Parliament (MP) by the first past the post voting system.
Elections to Wyre Borough Council in Lancashire, England are held every four years. Since the last boundary changes in 2003, 55 councillors have been elected from 26 wards.
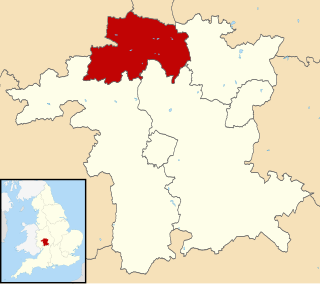
Wyre Forest is a local government district in Worcestershire, England, covering the towns of Kidderminster, Stourport-on-Severn and Bewdley, and several civil parishes and their villages. Its council was previously based in Stourport-on-Severn, but moved to new purpose built offices on the outskirts of Kidderminster in 2012.
The Blaenau Gwent People's Voice Group was a political party based in the Blaenau Gwent area of Wales.
Hambleton is a village and civil parish in the English county of Lancashire. It is situated on a coastal plain called the Fylde and in an area east of the River Wyre known locally as Over Wyre. Hambleton lies approximately 3 miles (4.8 km) north-east of its post town, Poulton-le-Fylde, and about 7 miles (11 km) north-east of the seaside resort of Blackpool. In the 2001 United Kingdom census, the parish had a population of 2,678, increasing to 2,744 at the 2011 census.
Elections to Tonbridge and Malling Borough Council in Kent, United Kingdom are held every four years. Since the last boundary changes in 2003, 53 councillors have been elected from 26 wards.
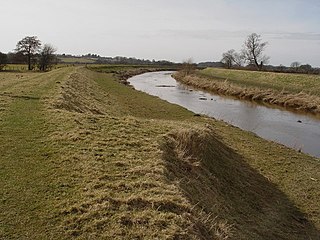
Great Eccleston is a village and civil parish in the English county of Lancashire, situated on a coastal plain called the Fylde. The village lies to the south of the River Wyre and the A586 road, approximately 10 miles (16 km) upstream from the port of Fleetwood. At the 2001 United Kingdom census, the parish had a population of 1,473, rising slightly to 1,486 at the Census 2011.
Redcar and Cleveland is a unitary authority in North Yorkshire, England. Until 1 April 1996 it was a non-metropolitan district in Cleveland.
The 2004 Wyre Forest District Council election took place on 10 June 2004 to elect members of Wyre Forest District Council in Worcestershire, England. The whole council was up for election with boundary changes since the last election in 2003. The council stayed under no overall control, but with the Conservatives taking over as the largest party on the council from the Health Concern party.
Local elections were held in the United Kingdom on 3 May 1979. The results provided some source of comfort to the Labour Party (UK), who recovered some lost ground from local election reversals in previous years, despite losing the general election to the Conservative Party on the same day.
Elections to Wyre Borough Council were held on 5 May 2011, along with the United Kingdom Alternative Vote referendum, 2011. All 55 councillors were elected from 26 wards in elections held every four years. The Conservative Party stayed in overall control of the council.
Elections to Wyre Borough Council were held on 3 May 2007. All 55 councillors were elected from 26 wards in elections held every four years. The Conservative Party kept hold overall control of the council.
The 2003 Barnsley Metropolitan Borough Council election took place on 1 May 2003 to elect members of Barnsley Metropolitan Borough Council in South Yorkshire, England. One third of the council was up for election and the Labour party stayed in overall control of the council.
Local elections are to be held for Wyre Borough Council on 7 May 2015, the same day as the United Kingdom general election, 2015 and other United Kingdom local elections, 2015. Local elections are held every four years with all councillors up for election in multi-member electoral wards.
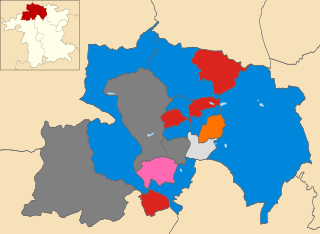
The 2011 Wyre Forest District Council election took place on 5 May 2011 to elect members of Wyre Forest District Council in Worcestershire, England. One third of the council was up for election and the Conservative party stayed in overall control of the council.
The 2015 Wyre Forest District Council election took place on 7 May 2015 to elect members of Wyre Forest District Council in Worcestershire, England. The whole council was up for election after boundary changes reduced the number of seats by nine. The Conservative party gained overall control of the council from no overall control.