| ||
| Elections in Oklahoma |
|---|
The 1914 Oklahoma elections were held on November 3, 1914, in the U.S. state of Oklahoma. Oklahoma voters elected statewide officials and members of the United States House of Representatives.
| District | Incumbent | This race | |||
|---|---|---|---|---|---|
| Member | Party | First elected | Results | Candidates [1] | |
| Oklahoma 1 | Bird S. McGuire | Republican | 1907 | Incumbent retired. Republican loss. |
|
| James S. Davenport Redistricted from the 3rd district | Democratic | 1910 | Incumbent re-elected. | ||
| Oklahoma 2 | None (New district) | New district. Democratic gain. |
| ||
| Oklahoma 3 | Charles D. Carter Redistricted from the 4th district | Democratic | 1907 | Incumbent re-elected. |
|
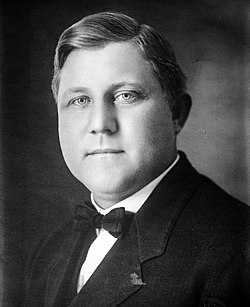
| Oklahoma 4 | William H. Murray Redistricted from the at-large seat | Democratic | 1912 | Incumbent re-elected. |
|
| Oklahoma 5 | Joseph B. Thompson Redistricted from the at-large seat | Democratic | 1912 | Incumbent re-elected. |
|
| Claude Weaver Redistricted from the at-large seat | Democratic | 1912 | Incumbent lost renomination. Democratic loss. | ||
| Oklahoma 6 | Scott Ferris Redistricted from the 5th district | Democratic | 1907 | Incumbent re-elected. |
|
| Oklahoma 7 | None (New district) | New district. Democratic gain. |
| ||
| Oklahoma 8 | Dick T. Morgan Redistricted from the 2nd district | Republican | 1908 | Incumbent re-elected. |
|
| Party | Candidate | Votes | % | |
|---|---|---|---|---|
| Democratic | Thomas Gore (inc.) | 119,442 | 47.98% | |
| Republican | John H. Burford | 73,292 | 29.44% | |
| Socialist | Patrick S. Nagle | 52,229 | 20.98% | |
| Progressive | William O. Cromwell | 3,966 | 1.59% | |
| Majority | 46,150 | 18.54% | ||
| Total votes | 248,929 | 100.00% | ||
| Democratic hold | ||||
| Party | Candidate | Votes | % | ±% | |
|---|---|---|---|---|---|
| Democratic | Robert L. Williams | 100,597 | 39.6% | −8.9% | |
| Republican | John Fields | 95,904 | 37.8% | −2.3% | |
| Socialist | Fred W. Holt | 52,703 | 20.7% | +10.8% | |
| Progressive | John P. Hickam | 4,189 | 1.6% | New | |
| Independent | Amos L. Wilson | 206 | 1.6% | N/A | |
| Independent | T. J. Wood | 88 | 0.0% | N/A | |
| Democratic hold | Swing | -8.9% | |||
| |||||||||||||||||||||
| |||||||||||||||||||||
County results Trapp: 30–40% 40–50% 50–60% Lawson: 30–40% 40–50% 50–60% Hamilton: 30–40% 40–50% | |||||||||||||||||||||
| |||||||||||||||||||||
Democratic Primary
| Party | Candidate | Votes | % | |
|---|---|---|---|---|
| Democratic | Martin E. Trapp | 18,178 | 16.0% | |
| Democratic | Ben F. Lafayette | 17,192 | 15.1% | |
| Democratic | Pete P. Duffy | 16,307 | 14.3% | |
| Democratic | Frank F. Davis | 14,498 | 12.7% | |
| Democratic | Woodson Norvell | 11,351 | 9.9% | |
| Democratic | Edwin Sorrells | 10,646 | 9.3% | |
| Democratic | Richard Billups | 10,233 | 9.0% | |
| Democratic | John W. Barbour | 8,704 | 7.6% | |
| Democratic | Bert Van Leuven | 3,312 | 2.9% | |
| Democratic | Robert H. Oury | 3,123 | 2.7% | |
| Turnout | 113,544 | |||
Republican primary
| Party | Candidate | Votes | % | |
|---|---|---|---|---|
| Republican | Eugene B. Lawson | 21,191 | 100% | |
Socialist primary
| Party | Candidate | Votes | % | |
|---|---|---|---|---|
| Socialist | George G. Hamilton | 15,821 | 100% | |
Progressive primary
| Party | Candidate | Votes | % | |
|---|---|---|---|---|
| Progressive | J. M. Marrow | 1,309 | 59.6% | |
| Progressive | J. R. Lankard | 885 | 40.3% | |
| Turnout | 2,194 | |||
Prohibition primary
| Party | Candidate | Votes | % | |
|---|---|---|---|---|
| Prohibition | A. H. Crawford | 49 | 100% | |
General election
| Party | Candidate | Votes | % | ±% | |
|---|---|---|---|---|---|
| Democratic | Martin E. Trapp | 104,285 | 42.9% | −6.4% | |
| Republican | Eugene B. Lawson | 80,419 | 33.1% | −6.2% | |
| Socialist | George G. Hamilton | 53,072 | 21.8% | +11.9% | |
| Progressive | J. M. Morrow | 4,459 | 1.8% | New | |
| Prohibition | A. H. Crawford | 668 | 0.2% | −1.1% | |
| Democratic hold | Swing | ||||
| |||||||||||||||||||||
| |||||||||||||||||||||
County results Lyon: 30–40% 40–50% 50–60% Prentiss: 30–40% 40–50% 50–60% Sinclair: 30–40% 40–50% | |||||||||||||||||||||
| |||||||||||||||||||||
Democratic Primary
| Party | Candidate | Votes | % | |
|---|---|---|---|---|
| Democratic | Joseph Lucien Lyon | 32,770 | 30.8% | |
| Democratic | J. S. Askew | 31,362 | 29.5% | |
| Democratic | Kirby Frans | 18,116 | 17.0% | |
| Democratic | Edward G. Spillman | 14,619 | 13.7% | |
| Democratic | J. Y. Battenfield | 9,192 | 8.6% | |
| Turnout | 106,059 | |||
Republican primary
| Party | Candidate | Votes | % | |
|---|---|---|---|---|
| Republican | Marvin B. Prentiss | 26,947 | 100% | |
Socialist primary
| Party | Candidate | Votes | % | |
|---|---|---|---|---|
| Socialist | H. M. Sinclair | 15,820 | 100% | |
Progressive primary
| Party | Candidate | Votes | % | |
|---|---|---|---|---|
| Progressive | P. S. Coleman | 1,102 | 50.5% | |
| Progressive | Dan W. Patton | 1,080 | 49.4% | |
| Turnout | 2,182 | |||
General election
| Party | Candidate | Votes | % | ±% | |
|---|---|---|---|---|---|
| Democratic | Joseph Lucien Lyon | 107,456 | 44.7% | −4.6% | |
| Republican | Marvin B. Prentiss | 75,259 | 31.3% | −8.1% | |
| Socialist | H. M. Sinclair | 52,963 | 22.0% | +12.2% | |
| Progressive | Dan W. Patton | 4,527 | 1.8% | New | |
| Democratic hold | Swing | ||||
Democratic Primary
| Party | Candidate | Votes | % | |
|---|---|---|---|---|
| Democratic | Everette B. Howard | 39,601 | 38.7% | |
| Democratic | Frank C. Carter | 38,743 | 37.9% | |
| Democratic | Frank B. Lucas | 23,846 | 23.3% | |
| Turnout | 102,190 | |||
Republican primary
| Party | Candidate | Votes | % | |
|---|---|---|---|---|
| Republican | Geo. H. Foster | 27,522 | 100% | |
Socialist primary
| Party | Candidate | Votes | % | |
|---|---|---|---|---|
| Socialist | S. H. Colwick | 15,803 | 100% | |
Progressive primary
| Party | Candidate | Votes | % | |
|---|---|---|---|---|
| Progressive | B. F. Morris | 1,313 | 60.7% | |
| Progressive | L. D. Burton | 848 | 39.2% | |
| Turnout | 2,161 | |||
Prohibition primary
| Party | Candidate | Votes | % | |
|---|---|---|---|---|
| Prohibition | D. A. Holmes | 48 | 100% | |
| Turnout | 48 | |||
General election
| Party | Candidate | Votes | % | ±% | |
|---|---|---|---|---|---|
| Democratic | Everette B. Howard | 107,728 | 44.7% | −5.4% | |
| Republican | Geo. H. Foster | 75,404 | 31.3% | −8.5% | |
| Socialist | S. H. Colwick | 52,605 | 21.8% | +11.8% | |
| Progressive | B. F. Morris | 4,468 | 1.8% | New | |
| Prohibition | D. A. Holmes | 677 | 0.2% | New | |
| Democratic hold | Swing | ||||
Democratic Primary
| Party | Candidate | Votes | % | |
|---|---|---|---|---|
| Democratic | Sargent Prentiss Freeling | 26,085 | 23.2% | |
| Democratic | Geo. D. Key | 24,190 | 21.5% | |
| Democratic | Ed P. Hill | 18,060 | 16.0% | |
| Democratic | E. J. Giddings | 16,444 | 14.6% | |
| Democratic | Fred S. Caldwell | 15,843 | 14.1% | |
| Democratic | Chas. M. Cope | 11,735 | 10.4% | |
| Turnout | 112357 | |||
Republican primary
| Party | Candidate | Votes | % | |
|---|---|---|---|---|
| Republican | Walter C. Stevens | 27,490 | 100% | |
Socialist primary
| Party | Candidate | Votes | % | |
|---|---|---|---|---|
| Socialist | W. T. Banks | 15,823 | 100% | |
Progressive primary
| Party | Candidate | Votes | % | |
|---|---|---|---|---|
| Progressive | John A. Haver | 2,060 | 100% | |
General election
| Party | Candidate | Votes | % | ±% | |
|---|---|---|---|---|---|
| Democratic | Sargent Prentiss Freeling | 106,412 | 44.0% | −6.5% | |
| Republican | Walter C. Stevens | 77521 | 32.0% | −7.5% | |
| Socialist | W. T. Banks | 52989 | 21.9% | +12.0% | |
| Progressive | John A. Haver | 4617 | 1.9% | New | |
| Democratic hold | Swing | ||||
Democratic Primary
| Party | Candidate | Votes | % | |
|---|---|---|---|---|
| Democratic | William Lee Alexander | 43,288 | 40.6% | |
| Democratic | Joseph C. McClelland | 38,926 | 36.5% | |
| Democratic | Abner Bruce | 24,375 | 22.8% | |
| Turnout | 106,589 | |||
Republican primary
| Party | Candidate | Votes | % | |
|---|---|---|---|---|
| Republican | L. Mathis | 27,033 | 100% | |
Socialist primary
| Party | Candidate | Votes | % | |
|---|---|---|---|---|
| Socialist | Oles Stofer | 15,758 | 100% | |
Progressive primary
| Party | Candidate | Votes | % | |
|---|---|---|---|---|
| Progressive | F. N. Winslow | 1,942 | 100% | |
General election
| Party | Candidate | Votes | % | ±% | |
|---|---|---|---|---|---|
| Democratic | William Lee Alexander | 107,700 | 44.7% | −4.9 | |
| Republican | L. Mathis | 75,451 | 31.3% | −7.9% | |
| Socialist | Oles Stofer | 52,677 | 21.9% | +12% | |
| Progressive | F. N. Winslow | 4,695 | 1.9% | New | |
| Democratic hold | Swing | ||||
Democratic Primary
| Party | Candidate | Votes | % | |
|---|---|---|---|---|
| Democratic | R. H. Wilson (incumbent) | 64,807 | 63.6% | |
| Democratic | Clinton M. Allen | 37,084 | 36.3% | |
| Turnout | 101891 | |||
Republican primary
| Party | Candidate | Votes | % | |
|---|---|---|---|---|
| Republican | C. G. Vannest | 26,581 | 100% | |
Socialist primary
| Party | Candidate | Votes | % | |
|---|---|---|---|---|
| Socialist | J. O. Weldy | 15,700 | 100% | |
Progressive primary
| Party | Candidate | Votes | % | |
|---|---|---|---|---|
| Progressive | Cyris H. Parrick | 2,103 | 100% | |
General election
| Party | Candidate | Votes | % | ±% | |
|---|---|---|---|---|---|
| Democratic | R. H. Wilson (incumbent) | 107,686 | 44.7% | −5.6% | |
| Republican | C. G. Vannest | 75705 | 31.4% | −8.2% | |
| Socialist | J. O. Welday | 52658 | 21.8% | +11.8% | |
| Progressive | Cyris H. Parrick | 4,584 | 1.9% | New | |
| Democratic hold | Swing | ||||
Democratic Primary
| Party | Candidate | Votes | % | |
|---|---|---|---|---|
| Democratic | Fred Parkinson (incumbent) | 51,474 | 55.3% | |
| Democratic | Hugh Gerner | 40,436 | 43.4% | |
| Democratic | E. J. Mitchell | 1,064 | 1.1% | |
| Turnout | 92974 | |||
Republican primary
| Party | Candidate | Votes | % | |
|---|---|---|---|---|
| Republican | John S. Woofter | 26,683 | 100% | |
Socialist primary
| Party | Candidate | Votes | % | |
|---|---|---|---|---|
| Socialist | John Hagel | 15,643 | 100% | |
Progressive primary
| Party | Candidate | Votes | % | |
|---|---|---|---|---|
| Progressive | Harry H. Keener | 2,069 | 100% | |
General election
| Party | Candidate | Votes | % | ±% | |
|---|---|---|---|---|---|
| Democratic | Fred Parkinson (incumbent) | 107,002 | 44.8% | −6.2% | |
| Republican | John S. Woofter | 74,215 | 31.1% | −8.6% | |
| Socialist | John Hagel | 52,758 | 22.1% | +10.0% | |
| Progressive | Harry H. Keener | 4,467 | 1.8% | New | |
| Democratic hold | Swing | ||||
Democratic Primary
| Party | Candidate | Votes | % | |
|---|---|---|---|---|
| Democratic | Ed Boyle (incumbent) | 37,905 | 36.7% | |
| Democratic | Pete Hanraty | 26,366 | 25.5% | |
| Democratic | Martin Clark | 25,220 | 24.4% | |
| Democratic | J. H. Needham | 13,556 | 13.1% | |
| Turnout | 103,047 | |||
Republican primary
| Party | Candidate | Votes | % | |
|---|---|---|---|---|
| Republican | Pat W. Mallory | 26,587 | 100% | |
Socialist primary
| Party | Candidate | Votes | % | |
|---|---|---|---|---|
| Socialist | Patrick O'Shea | 15,761 | 100% | |
General election
| Party | Candidate | Votes | % | ±% | |
|---|---|---|---|---|---|
| Democratic | Ed Boyle (incumbent) | 107,605 | 45.5% | −4.3% | |
| Republican | Pat W. Malloy | 75,266 | 31.8% | −8.1% | |
| Socialist | Patrick O'Shea | 53,266 | 22.5% | +10.3% | |
| Democratic hold | Swing | ||||
Democratic Primary
| Party | Candidate | Votes | % | |
|---|---|---|---|---|
| Democratic | W. G. Ashton | 60,975 | 66.6% | |
| Democratic | Pete Garaghty | 30,486 | 33.3% | |
| Turnout | 91461 | |||
Republican primary
| Party | Candidate | Votes | % | |
|---|---|---|---|---|
| Republican | Will M. Phares | 26,380 | 100% | |
Socialist primary
| Party | Candidate | Votes | % | |
|---|---|---|---|---|
| Socialist | J. Luther Langston | 15,790 | 100% | |
General election
| Party | Candidate | Votes | % | ±% | |
|---|---|---|---|---|---|
| Democratic | W. G. Ashton | 106,802 | 45.5% | −4.9% | |
| Republican | Will M. Phares | 74314 | 31.6% | −7.8% | |
| Socialist | U. G. Tuttle | 53316 | 22.7% | +12.7% | |
| Democratic hold | Swing | ||||
Democratic Primary
| Party | Candidate | Votes | % | |
|---|---|---|---|---|
| Democratic | William D. Matthews | 21,720 | 20.1% | |
| Democratic | Mabel Bassett | 19,083 | 17.7% | |
| Democratic | Ruth Dickinson Clement | 13,666 | 12.6% | |
| Democratic | Frank Naylor | 13,563 | 12.5% | |
| Democratic | Anna Laskey | 11,906 | 11.0% | |
| Democratic | Dorothy Briley | 8,654 | 8.0% | |
| Democratic | Ella Bilbo | 7,488 | 6.9% | |
| Democratic | Czarina Conlan | 7,426 | 6.8% | |
| Democratic | Roxanna R. Oxford | 4,296 | 3.9% | |
| Turnout | 107812 | |||
Republican primary
| Party | Candidate | Votes | % | |
|---|---|---|---|---|
| Republican | Alice M. Curtice | 26,854 | 100% | |
Socialist primary
| Party | Candidate | Votes | % | |
|---|---|---|---|---|
| Socialist | Florence Anderson | 15,770 | 100% | |
Progressive primary
| Party | Candidate | Votes | % | |
|---|---|---|---|---|
| Progressive | Laura M. McLain | 1,404 | 63.4% | |
| Progressive | F. W. Smith | 809 | 36.5% | |
| Turnout | 2213 | |||
Prohibition primary
| Party | Candidate | Votes | % | |
|---|---|---|---|---|
| Prohibition | Hettie H. Leonard | 48 | 100% | |
General election
| Party | Candidate | Votes | % | ±% | |
|---|---|---|---|---|---|
| Democratic | William D. Matthews | 105,663 | 44.0% | −7.0% | |
| Republican | Alice A. Curtice | 76,167 | 31.7% | −7.1% | |
| Socialist | Florence Anderson | 52,984 | 22.0% | +12.0% | |
| Progressive | Laura M. McClain | 4,612 | 1.9% | New | |
| Prohibition | Hettie H. Leonard | 694 | 0.2% | New | |
| Democratic hold | Swing | ||||
Democratic Primary
| Party | Candidate | Votes | % | |
|---|---|---|---|---|
| Democratic | A. L. Welch (incumbent) | 29,986 | 29.2% | |
| Democratic | Arthur W. Pettit | 15,270 | 14.8% | |
| Democratic | C. M. Brewer | 14,832 | 14.4% | |
| Democratic | James A. Jones | 11,945 | 11.6% | |
| Democratic | Eli W. Hardin | 10,283 | 10.0% | |
| Democratic | J. J. Barnes | 8,744 | 8.5% | |
| Democratic | John L. Spengler | 6,359 | 6.2% | |
| Democratic | W. T. S. Barnes | 5,118 | 4.9% | |
| Turnout | 102537 | |||
Republican primary
| Party | Candidate | Votes | % | |
|---|---|---|---|---|
| Republican | Fred B. Hoyt | 26,356 | 100% | |
Socialist primary
| Party | Candidate | Votes | % | |
|---|---|---|---|---|
| Socialist | Thomas W. Woodrow | 15,776 | 100% | |
Progressive primary
| Party | Candidate | Votes | % | |
|---|---|---|---|---|
| Progressive | Sam J. Storm | 2,042 | 100% | |
General election
| Party | Candidate | Votes | % | ±% | |
|---|---|---|---|---|---|
| Democratic | A. L. Welch (incumbent) | 106,828 | 44.8% | −5.0% | |
| Republican | Fred B. Hoyt | 74,287 | 31.1% | −8.9% | |
| Socialist | Thomas W. Woodrow | 52,644 | 22.0% | +11.9% | |
| Progressive | Sam J. Storm | 4,414 | 1.8% | New | |
| Independent | I. P. Mantz | 212 | 0.0% | New | |
| Democratic hold | Swing | ||||
Democratic Primary
| Party | Candidate | Votes | % | |
|---|---|---|---|---|
| Democratic | Frank M. Gault | 38,412 | 37.1% | |
| Democratic | J. J. McAlester | 34,590 | 33.4% | |
| Democratic | G. H. Adams | 18,405 | 17.7% | |
| Democratic | John B. Favor | 9,307 | 8.9% | |
| Democratic | Walter H. Mansfield | 2,703 | 2.6% | |
| Turnout | 103417 | |||
Republican primary
| Party | Candidate | Votes | % | |
|---|---|---|---|---|
| Republican | Harlan Emerson | 26,441 | 100% | |
Socialist primary
| Party | Candidate | Votes | % | |
|---|---|---|---|---|
| Socialist | John G. Wills | 15,539 | 100% | |
Progressive primary
| Party | Candidate | Votes | % | |
|---|---|---|---|---|
| Progressive | R. M. Bressie | 1,887 | 100% | |
General election
| Party | Candidate | Votes | % | ±% | |
|---|---|---|---|---|---|
| Democratic | Frank M. Gault | 107,501 | 45.1% | −4.9% | |
| Republican | Harlan Emerson | 74,339 | 31.2% | −8.6% | |
| Socialist | John G. Willis | 51875 | 21.8% | +11.8% | |
| Progressive | R. M. Bressie | 4237 | 1.7% | New | |
| Democratic hold | Swing | ||||
Democratic Primary
| Party | Candidate | Votes | % | |
|---|---|---|---|---|
| Democratic | A. P. Watson (incumbent) | 32,503 | 32.1% | |
| Democratic | William T. Field | 19,463 | 19.2% | |
| Democratic | Henry J. Denton | 17,244 | 17.0% | |
| Democratic | Henry B. Roach | 16,482 | 16.2% | |
| Democratic | R. P. Bowles | 15,310 | 15.1% | |
| Turnout | 101002 | |||
Republican primary
| Party | Candidate | Votes | % | |
|---|---|---|---|---|
| Republican | Sherman W. Hill | 26,321 | 100% | |
Socialist primary
| Party | Candidate | Votes | % | |
|---|---|---|---|---|
| Socialist | Allen Fields | 15,373 | 100% | |
Progressive primary
| Party | Candidate | Votes | % | |
|---|---|---|---|---|
| Progressive | G. R. McKinley | 1,368 | 67.9% | |
| Progressive | Lew Betts | 646 | 32.0% | |
| Turnout | 2014 | |||
Prohibition primary
| Party | Candidate | Votes | % | |
|---|---|---|---|---|
| Prohibition | Amos Phifer | 47 | 100% | |
General election
| Party | Candidate | Votes | % | ±% | |
|---|---|---|---|---|---|
| Democratic | A. P. Watson (incumbent) | 106,280 | 44.4% | −4.0% | |
| Republican | Sherman W. Hill | 74,279 | 31.0% | −12.2% | |
| Socialist | Allen Fields | 53060 | 22.1% | +13.7% | |
| Progressive | G. R. McKinley | 4991 | 2.0% | New | |
| Prohibition | Amos Phifer | 610 | 0.2% | New | |
| Democratic hold | Swing | ||||
Democratic Primary
| Party | Candidate | Votes | % | |
|---|---|---|---|---|
| Democratic | William M. Franklin | 25,055 | 30.3% | |
| Democratic | Swamp Campbell (incumbent) | 23,625 | 28.6% | |
| Democratic | Gus Pool | 21,527 | 26.0% | |
| Democratic | Chas. S. Albright | 12,398 | 15.0% | |
| Turnout | 82605 | |||
Republican primary
| Party | Candidate | Votes | % | |
|---|---|---|---|---|
| Republican | Zack T. Pryse | 25,543 | 100% | |
Socialist primary
| Party | Candidate | Votes | % | |
|---|---|---|---|---|
| Socialist | R. E. Dooley | 15,438 | 100% | |
Progressive primary
| Party | Candidate | Votes | % | |
|---|---|---|---|---|
| Progressive | J. W. Speaks | 1,820 | 100% | |
General election
| Party | Candidate | Votes | % | ±% | |
|---|---|---|---|---|---|
| Democratic | William M. Franklin | 107,657 | 45.1% | −4.9% | |
| Republican | Zack T. Pryse | 73,451 | 30.8% | −9.0% | |
| Socialist | R. E. Dooley | 52840 | 22.1% | +12.1% | |
| Progressive | J. W. Speake | 4413 | 1.8% | New | |
| Democratic hold | Swing | ||||
| | This section is empty. You can help by adding to it. (February 2024) |
| | This section is empty. You can help by adding to it. (February 2024) |
| | This section is empty. You can help by adding to it. (February 2024) |
| | This section is empty. You can help by adding to it. (February 2024) |