2006 United States House of Representatives election ratings

Last updated

2006 United States House of Representatives election ratings
Flag of the United States.svg
 2004
2008  

The 2006 United States House of Representatives elections were held on November 7, 2006, with early voting taking place in some states in the weeks preceding that date. Voters chose representatives from all 435 congressional districts across each of the 50 U.S. states. Non-voting delegates from the District of Columbia and three of the four inhabited U.S. territories were also elected. These elections took place halfway through the second term of Republican President George W. Bush. The winners served in the 110th United States Congress, with seats apportioned among the states based on the 2000 United States census. On Election Day, Republicans had held a House majority since January 1995 as a result of the 2006 elections.

Contents

Election ratings

The following table rates the competitiveness of selected races from around the country according to noted political analysts. Races not included should be considered safe for the incumbent's party.

District CPVI IncumbentPrevious
result
Cook
November 6, 2006 [1]
Rothenberg
November 6, 2006 [2]
Sabato
November 6, 2006 [3]
RCP
November 6, 2006 [4]
CQ Politics
November 7, 2006 [5]
Winner
Arizona 1 R+2 Rick Renzi (R)58.6% RTossupTilt RTilt RLean RTossup Rick Renzi (R)
Arizona 5 R+4 J. D. Hayworth (R)59.5% RTossupTilt D (flip)Tilt D (flip)TossupTossup Harry Mitchell (D)
Arizona 8 R+1 Jim Kolbe (R) (retiring)60.4% RLean D (flip)Likely D (flip)Likely D (flip)Lean D (flip)Likely D (flip) Gabby Giffords (D)
California 4 R+11 John Doolittle (R)65.4% RLean RTilt RLean RLean RLean R John Doolittle (R)
California 11 R+3 Richard Pombo (R)61.3% RTossupTossupTilt D (flip)TossupLean R Jerry McNerney (D)
California 50 R+5 Brian Bilbray (R)49.3% RLean RLikely RLean RSafe RLean R Brian Bilbray (R)
Colorado 3 R+6 John Salazar (D)50.5% DLikely DSafe DSafe DSafe DLikely D John Salazar (D)
Colorado 4 R+9 Marilyn Musgrave (R)51.0% RTossupTilt RTilt D (flip)Lean RLean R Marilyn Musgrave (R)
Colorado 5 R+16 Joel Hefley (R) (retiring)70.6% RLean RLikely RLean RSafe RLikely R Doug Lamborn (R)
Colorado 6 R+10 Tom Tancredo (R)59.7% RSafe RSafe RLikely RSafe RSafe R Tom Tancredo (R)
Colorado 7 D+2 Bob Beauprez (R) (retiring) [lower-alpha 1] 54.7% RLean D (flip)Likely D (flip)Likely D (flip)Lean D (flip)Lean D (flip) Ed Perlmutter (D)
Connecticut 2 D+8 Rob Simmons (R)54.2% RTossupTossupTilt D (flip)Lean RLean R Joe Courtney (D)
Connecticut 4 D+5 Chris Shays (R)52.4% RTossupTossupTilt D (flip)TossupTossup Chris Shays (R)
Connecticut 5 D+4 Nancy Johnson (R)59.8% RTossupTilt D (flip)Tilt D (flip)TossupTossup Chris Murphy (D)
Florida 8 R+3 Ric Keller (R)60.5% RLikely RSafe RLikely RSafe RLikely R Ric Keller (R)
Florida 9 R+4 Michael Bilirakis (R)100% RLikely RSafe RLikely RSafe RLikely R Gus Bilirakis (R)
Florida 13 R+4 Katherine Harris (R) (retiring) [lower-alpha 2] 55.3% RTossupTilt D (flip)Lean D (flip)TossupTossup Vern Buchanan (R)
Florida 16 R+2Vacant [lower-alpha 3] 68.0% RTossupTossupTilt D (flip)Lean D (flip)Lean D (flip) Tim Mahoney (D)
Florida 22 D+4 Clay Shaw (R)62.9% RTossupTossupTilt D (flip)Lean RTossup Ron Klein (D)
Georgia 8 R+8 Jim Marshall (D)62.9% DLean DTilt DLean DTossupLean D Jim Marshall (D)
Georgia 12 D+2 John Barrow (D)51.8% DLikely DTilt DTilt DTossupLean D John Barrow (D)
Idaho 1 R+19 Butch Otter (R) (retiring) [lower-alpha 1] 69.5% RTossupTilt RTilt D (flip)Lean RLean R Bill Sali (R)
Illinois 6 R+3 Henry Hyde (R) (retiring)55.8% RTossupTossupTilt D (flip)TossupTossup Peter Roskam (R)
Illinois 8 R+5 Melissa Bean (D)51.7% DLean DTilt DLean DLean DLean D Melissa Bean (D)
Illinois 10 D+4 Mark Kirk (R)64.1% RLikely RSafe RLean RSafe RLikely R Mark Kirk (R)
Illinois 17 D+5 Lane Evans (D) (retiring)60.7% DLikely DSafe DSafe DSafe DLikely D Phil Hare (D)
Indiana 2 R+4 Chris Chocola (R)54.2% RTossupLean D (flip)Lean D (flip)TossupTossup Joe Donnelly (D)
Indiana 3 R+16 Mark Souder (R)69.2% RLikely RSafe RLikely RSafe RLikely R Mark Souder (R)
Indiana 7 D+9 Julia Carson (D)54.3% DLikely DSafe DLikely DLean DLikely D Julia Carson (D)
Indiana 8 R+9 John Hostettler (R)53.4% RTossupLikely D (flip)Likely D (flip)Lean D (flip)Lean D (flip) Brad Ellsworth (D)
Indiana 9 R+7 Mike Sodrel (R)49.4% RTossupTilt D (flip)Tilt D (flip)TossupTossup Baron Hill (D)
Iowa 1 D+5 Jim Nussle (R) (retiring) [lower-alpha 1] 55.2% RLean D (flip)Lean D (flip)Lean D (flip)Lean D (flip)Lean D (flip) Bruce Braley (D)
Iowa 2 D+7 Jim Leach (R)58.9% RLikely RSafe RLean RSafe RLikely R Dave Loebsack (D)
Iowa 3 D+1 Leonard Boswell (D)55.2% DLean DLean DLean DLean DLean D Leonard Boswell (D)
Kansas 2 R+7 Jim Ryun (R)56.1% RTossupTossupTilt RSafe RLikely R Nancy Boyda (D)
Kansas 3 R+4 Dennis Moore (D)54.8% DLikely DSafe DSafe DSafe DLikely D Dennis Moore (D)
Kentucky 2 R+13 Ron Lewis (R)67.9% RLean RLikely RLean RSafe RLean R Ron Lewis (R)
Kentucky 3 D+2 Anne Northup (R)60.3% RTossupTilt RTilt RTossupLean R John Yarmuth (D)
Kentucky 4 R+12 Geoff Davis (R)54.4% RLean RTilt RTilt D (flip)Lean RLean R Geoff Davis (R)
Louisiana 2 D+28 William Jefferson (D)79.0% DLikely DSafe DSafe DSafe DSafe D William Jefferson (D)
Louisiana 3 R+5 Charlie Melançon (D)50.2% DLean DSafe DLikely DSafe DLikely D Charlie Melançon (D)
Louisiana 7 R+7 Charles Boustany (R)55.0% RSafe RSafe RSafe RSafe RLikely R Charles Boustany (R)
Maryland 3 D+7 Ben Cardin (D) (retiring) [lower-alpha 2] 63.4% DSafe DSafe DSafe DSafe DLikely D John Sarbanes (D)
Maryland 6 R+13 Roscoe Bartlett (R)67.5% RSafe RSafe RSafe RSafe RLikely R Roscoe Bartlett (R)
Michigan 7 R+2 Joe Schwarz (R) (lost renomination)58.4% RLikely RSafe RLikely RSafe RLikely R Tim Walberg (R)
Michigan 8 R+2 Mike Rogers (R)61.1% RSafe RSafe RSafe RSafe RLikely R Mike Rogers (R)
Minnesota 1 R+1 Gil Gutknecht (R)59.6% RTossupTossupTilt RLean RLean R Tim Walz (D)
Minnesota 2 R+3 John Kline (R)56.4% RSafe RSafe RLikely RSafe RLikely R John Kline (R)
Minnesota 6 R+5 Mark Kennedy (R) (retiring) [lower-alpha 2] 54.0% RTossupTossupTilt RLean RTossup Michele Bachmann (R)
Nebraska 1 R+11 Jeff Fortenberry (R)54.2% RSafe RSafe RSafe RSafe RLean R Jeff Fortenberry (R)
Nebraska 3 R+24 Tom Osborne (R) (retiring) [lower-alpha 1] 87.5% RLean RLikely RTilt RSafe RLean R Adrian Smith (R)
Nevada 2 R+8 Jim Gibbons (R) (retiring) [lower-alpha 1] 66.5% RLean RLikely RLean RLean RLean R Dean Heller (R)
Nevada 3 D+1 Jon Porter (R)54.5% RTossupTilt RTilt RLean RLean R Jon Porter (R)
New Hampshire 1 Even Jeb Bradley (R)63.4% RLikely RSafe RLikely RSafe RLikely R Carol Shea-Porter (D)
New Hampshire 2 D+3 Charles Bass (R)58.3% RTossupTilt D (flip)Tilt D (flip)TossupTossup Paul Hodes (D)
New Jersey 5 R+4 Scott Garrett (R)57.6% RSafe RSafe RSafe RSafe RLikely R Scott Garrett (R)
New Jersey 7 R+1 Mike Ferguson (R)56.9% RLean RLean RLean RSafe RLean R Mike Ferguson (R)
New Mexico 1 D+2 Heather Wilson (R)54.4% RTossupTossupTilt D (flip)TossupTossup Heather Wilson (R)
New York 3 D+2 Peter King (R)63.0% RLikely RLikely RLikely RSafe RLikely R Peter King (R)
New York 13 D+1 Vito Fossella (R)59.0% RSafe RSafe RSafe RSafe RLikely R Vito Fossella (R)
New York 19 R+1 Sue Kelly (R)66.7% RLean RLikely RTilt RLean RLean R John Hall (D)
New York 20 R+3 John E. Sweeney (R)65.8% RTossupTilt D (flip)Tilt D (flip)Lean D (flip)Tossup Kirsten Gillibrand (D)
New York 24 R+1 Sherwood Boehlert (R) (retiring)56.9% RLean D (flip)Tilt D (flip)Lean D (flip)Lean D (flip)Tossup Mike Arcuri (D)
New York 25 D+3 James T. Walsh (R)90.4% RLean RTilt RTilt RLean RLean R James T. Walsh (R)
New York 26 R+3 Thomas M. Reynolds (R)55.6% RTossupTossupTilt RLean RLean D (flip) Thomas M. Reynolds (R)
New York 29 R+5 Randy Kuhl (R)50.7% RLean RTilt RLean RLean RLean R Randy Kuhl (R)
North Carolina 8 R+3 Robin Hayes (R)55.5% RLikely RSafe RLean RSafe RLikely R Robin Hayes (R)
North Carolina 11 R+7 Charles Taylor (R)54.9% RLean D (flip)Tilt D (flip)Lean D (flip)Lean D (flip)Tossup Heath Shuler (D)
North Carolina 13 D+2 Brad Miller (D)58.8% DSafe DSafe DSafe DSafe DLikely D Brad Miller (D)
Ohio 1 R+1 Steve Chabot (R)59.8% RTossupTossupTilt RTossupTossup Steve Chabot (R)
Ohio 2 R+13 Jean Schmidt (R)51.6% RTossupTossupTilt D (flip)TossupTossup Jean Schmidt (R)
Ohio 6 Even Ted Strickland (D) (retiring) [lower-alpha 1] 100.0% DLikely DSafe DLikely DSafe DLikely D Charlie Wilson (D)
Ohio 12 R+1 Pat Tiberi (R)62.0% RLikely RLean RLikely RSafe RLikely R Pat Tiberi (R)
Ohio 13 D+6 Sherrod Brown (D) (retiring) [lower-alpha 2] 67.4% DLikely DSafe DSafe DSafe DLikely D Betty Sutton (D)
Ohio 15 R+1 Deborah Pryce (R)60.0% RTossupLean D (flip)Tilt D (flip)Lean D (flip)Tossup Deborah Pryce (R)
Ohio 18 R+6Vacant [lower-alpha 4] 66.2% RLean D (flip)Lean D (flip)Lean D (flip)Lean D (flip)Lean D (flip) Zack Space (D)
Oregon 5 D+1 Darlene Hooley (D)52.9% DLikely DSafe DSafe DSafe DLikely D Darlene Hooley (D)
Pennsylvania 4 R+3 Melissa Hart (R)63.1% RTossupTossupTilt RLean RLean R Jason Altmire (D)
Pennsylvania 6 D+2 Jim Gerlach (R)51.0% RTossupTossupLean D (flip)TossupTossup Jim Gerlach (R)
Pennsylvania 7 D+4 Curt Weldon (R)58.8% RTossupLean D (flip)Lean D (flip)Lean D (flip)Lean D (flip) Joe Sestak (D)
Pennsylvania 8 D+3 Mike Fitzpatrick (R)55.3% RTossupTossupTilt RLean RTossup Patrick Murphy (D)
Pennsylvania 10 R+8 Don Sherwood (R)92.8% RTossupLean D (flip)Lean D (flip)Lean D (flip)Lean D (flip) Chris Carney (D)
South Carolina 5 R+6 John Spratt (D)63.1% DLikely DSafe DSafe DSafe DLikely D John Spratt (D)
Texas 17 R+18 Chet Edwards (D)51.2% DLikely DSafe DLikely DSafe DLikely D Chet Edwards (D)
Texas 22 R+15Vacant [lower-alpha 5] 55.2% RTossupTossupTilt D (flip)Lean D (flip)Lean D (flip) Nick Lampson (D)
Texas 23 R+4 Henry Bonilla (R)69.3% RLean RLean RLean RSafe RLikely R Ciro Rodriguez (D)
Utah 2 R+17 Jim Matheson (D)54.8% DLikely DSafe DSafe DSafe DLikely D Jim Matheson (D)
Vermont at-large D+8 Bernie Sanders (I) (retiring) [lower-alpha 2] 67.4% ILean D (flip)Likely D (flip)Likely D (flip)Lean D (flip)Lean D (flip) Peter Welch (D)
Virginia 2 R+6 Thelma Drake (R)55.1% RTossupTossupTilt RLean RLean R Thelma Drake (R)
Virginia 11 R+5 Frank Wolf (R)63.7% RLikely RSafe RLean RSafe RLikely R Frank Wolf (R)
Washington 2 D+3 Rick Larsen (D)54.8% DLikely DSafe DSafe DSafe DLikely D Rick Larsen (D)
Washington 5 R+7 Cathy McMorris (R)59.7% RLikely RSafe RLean RSafe RLikely R Cathy McMorris (R)
Washington 8 D+2 Dave Reichert (R)51.5% RLean RTilt RTilt RLean RTossup Dave Reichert (R)
West Virginia 1 R+6 Alan Mollohan (D)67.8% DLikely DSafe DLikely DSafe DLikely D Alan Mollohan (D)
West Virginia 2 R+5 Shelley Moore Capito (R)57.5% RLikely RSafe RLikely RSafe RLikely R Shelley Moore Capito (R)
Wisconsin 8 Even Mark Green (R) (retiring) [lower-alpha 1] 70.1% RTossupTossupTilt RLean RTossup Steve Kagen (D)
Wyoming at-large R+19 Barbara Cubin (R)55.3% RTossupLikely RTilt RSafe RTossup Barbara Cubin (R)
Overall D - 207
R - 189
39 tossups
D - 220
R - 196
19 tossups
D - 233
R - 202
D - 214
R - 205
16 tossups
D - 213
R - 199
23 tossups
D - 233
R - 202

Notes

  1. 1 2 3 4 5 6 7 Retired to run for Governor
  2. 1 2 3 4 5 Retired to run for senate
  3. Incumbent Mark Foley (Republican) resigned in September 2006, seat left vacant until the next congress.
  4. Incumbent Bob Ney (Republican) resigned in November 2006, seat left vacant until the next congress.
  5. Incumbent Tom DeLay (Republican) resigned in June 2006, Shelley Sekula-Gibbs (R) won a simultaneous special election to fill the remainder of DeLay's term.

Related Research Articles

<span class="mw-page-title-main">2006 United States House of Representatives elections</span> House elections for the 110th U.S. Congress

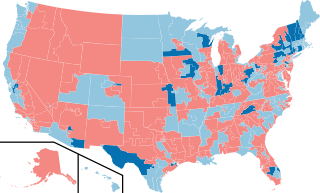
The 2006 United States House of Representatives elections were held on November 7, 2006, to elect members to the United States House of Representatives. It took place in the middle of President George W. Bush's second term in office. All 435 seats of the House were up for election. Those elected served in the 110th United States Congress from January 3, 2007, until January 3, 2009. The incumbent majority party, the Republicans, had won majorities in the House consecutively since 1994, and were defeated by the Democrats who won a majority in the chamber, ending 12 years of Republican control in the House.

<span class="mw-page-title-main">2006 Texas's 22nd congressional district elections</span> Elections for a seat in the U.S. House of Representatives

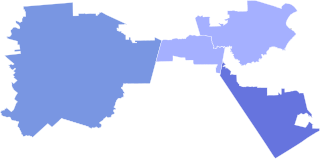
The 2006 Texas 22nd congressional district election for the 110th Congress was held on November 7, 2006, and attracted considerable attention because this district was represented by former House Majority Leader Tom DeLay, a prominent member of the Republican Party, who resigned after being indicted and subsequently winning the Republican primary. Because of Texas state law, Republicans, in order to hold on to the seat, would have had to win a write-in campaign, something that has only been done four other times in the history of U.S. congressional elections.

<span class="mw-page-title-main">2006 United States House of Representatives elections in Arizona</span>

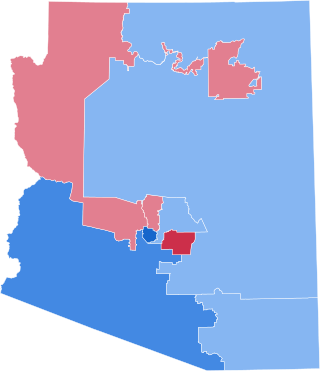
The 2006 congressional elections in Arizona were elections for Arizona's delegation to the United States House of Representatives, which occurred along with congressional elections nationwide on November 7, 2006. Arizona has eight seats, as apportioned during the 2000 United States census. Prior to the election, Republicans held six of the eight seats and Democrats held two. In the 8th district, Republican Congressman Jim Kolbe retired, leaving an open seat. Following the elections, Democrats gained two seats at the expense of the Republicans, who lost two.

<span class="mw-page-title-main">2006 Arizona's 8th congressional district election</span>

The 2006 Arizona 8th congressional district election was an election for the United States House of Representatives for the open seat of incumbent Republican Jim Kolbe, who was not running for re-election. The primary was held on September 12, 2006, and the two major party winners were Republican Randy Graf, a former state Representative who challenged Kolbe for the GOP nomination in 2004, and former State Senator Gabby Giffords. Libertarian Dave Nolan, who was uncontested in the primary, was also in the November 7, 2006 general election. Graf was considered too conservative for the district: Kolbe withheld his endorsement, and towards the end of the election the National GOP pulled their support. By election time, most non-partisan analyses considered this race the most likely district to switch hands, which it did, as Giffords won a decisive victory, 54% to 42%.

<span class="mw-page-title-main">New Mexico's congressional districts</span> U.S. House districts in the State of New Mexico

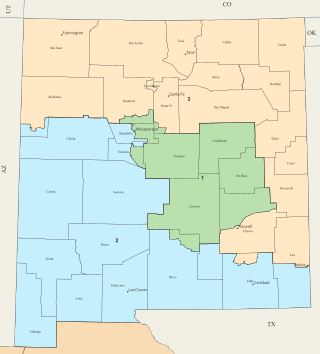
New Mexico is divided into three congressional districts, each represented by a member of the United States House of Representatives.

<span class="mw-page-title-main">2008 United States House of Representatives elections in Minnesota</span>

The 2008 Minnesota U.S. House of Representatives elections took place on November 4, 2008. All 8 congressional seats that make up the state's delegation were contested. Representatives were elected for two-year terms; those elected served in the 111th United States Congress from January 4, 2009 until January 3, 2011.

<span class="mw-page-title-main">2008 United States House of Representatives elections in New York</span>

The 2008 United States House of Representatives elections in New York were held on November 4, 2008, to elect the 29 U.S. representatives from the State of New York, one from each of the state's 29 congressional districts. state of New York in the United States House of Representatives. New York has 29 seats in the House, apportioned according to the 2000 United States census. Representatives are elected for two-year terms; those elected will serve in the 111th Congress from January 4, 2009, until January 3, 2011. The election coincided with the 2008 U.S. presidential election in which Democrat Barack Obama defeated Republican John McCain by a wide margin.

<span class="mw-page-title-main">2008 United States House of Representatives elections in Arizona</span>

The 2008 congressional elections in Arizona were held on November 4, 2008, to determine who would represent the state of Arizona in the United States House of Representatives, coinciding with the presidential election. Representatives are elected for two-year terms; those elected would serve in the 111th Congress from January 4, 2009, until January 3, 2011.

<span class="mw-page-title-main">2008 United States House of Representatives elections in West Virginia</span>

The 2008 congressional elections in West Virginia was held on November 4, 2008, to determine who would represent the state of West Virginia in the United States House of Representatives. Representatives are elected for two-year terms; whoever is elected will serve in the 111th Congress from January 4, 2009, until January 3, 2011. The election coincided with the 2008 U.S. presidential election.

<span class="mw-page-title-main">2008 United States House of Representatives elections in Idaho</span>

The 2008 congressional elections in Idaho were held on November 4, 2008 to determine who would represent the state of Idaho in the United States House of Representatives, coinciding with the presidential and senatorial elections. Representatives are elected for two-year terms; those elected were to serve in the 111th Congress from January 3, 2009 until January 3, 2011.

<span class="mw-page-title-main">2010 United States House of Representatives elections in Arizona</span> State elections

The 2010 congressional elections in Arizona were held on November 2, 2010, to determine who would represent the state of Arizona in the United States House of Representatives. Arizona had eight seats in the House, apportioned according to the 2000 United States census. Representatives were elected for two-year terms; those elected were to serve in the 112th Congress from January 3, 2011 until January 3, 2013.

<span class="mw-page-title-main">2012 United States House of Representatives elections in Washington</span> House elections for the 113th U.S. Congress

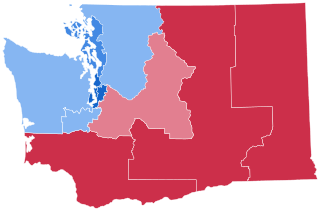
The 2012 United States House of Representatives elections in Washington were held on Tuesday, November 6, 2012, to elect the ten U.S. representatives from the state, one from each of the state's ten congressional districts, a gain of one seat following the 2010 United States census. The elections coincided with the elections of other federal and state offices, including a quadrennial presidential election, and a U.S. Senate election. The state certified the returns on December 6, 2012. Primary elections were held August 7, 2012.

<span class="mw-page-title-main">2012 United States House of Representatives elections in Oregon</span>

The 2012 United States House of Representatives elections in Oregon were held on Tuesday, November 6, 2012 to elect the five U.S. representatives from the state of Oregon, apportioned according to the 2010 United States census. The elections coincided with the elections of other federal and state offices, including a quadrennial presidential election. All five incumbents, four Democrats and one Republican, were re-elected to another term.

<span class="mw-page-title-main">2016 United States House of Representatives elections in Indiana</span>

The 2016 United States House of Representatives elections in Indiana were held on November 8, 2016, to elect the nine U.S. representatives from the state of Indiana, one from each of the state's nine congressional districts. The elections coincided with the 2016 U.S. presidential election, as well as other elections to the House of Representatives, elections to the United States Senate and various state and local elections. The primaries were held on May 3.

<span class="mw-page-title-main">2018 United States House of Representatives elections in Oklahoma</span>

The 2018 United States House of Representatives elections in Oklahoma were held on November 6, 2018, to elect the five U.S. representatives from the state of Oklahoma, one from each of the state's five congressional districts. The elections coincided with other elections to the House of Representatives, elections to the United States Senate and various state and local elections. Primary elections were held on June 26 and runoff elections were held two months later on August 28. The state’s U.S. House delegation Republican majority changed from 5-0 to 4-1. As of 2023 this is the only time since 2010 that Democrats won any house race in Oklahoma.

The 2018 United States House of Representatives elections were held on November 6, 2018, with early voting taking place in some states in the weeks preceding that date. Voters chose representatives from all 435 congressional districts across each of the 50 U.S. states. Non-voting delegates from the District of Columbia and four of the five inhabited U.S. territories were also elected. These midterm elections took place nearly halfway through the first term of Republican President Donald Trump. The winners will serve in the 116th United States Congress, with seats apportioned among the states based on the 2010 United States census. On Election Day, Republicans had held a House majority since January 2011 as a result of the 2010 elections.

<span class="mw-page-title-main">2020 United States House of Representatives elections in Louisiana</span>

The 2020 United States House of Representatives elections in Louisiana were held on November 3, 2020, to elect the six U.S. representatives from the state of Louisiana, one from each of the state's six congressional districts. The elections coincided with other elections to the House of Representatives, elections to the United States Senate, and various state and local elections.

<span class="mw-page-title-main">2014 United States House of Representatives election ratings</span> Predictions for select races in the 2014 U.S. House elections

The 2014 United States House of Representatives elections were held on November 4, 2014, with early voting taking place in some states in the weeks preceding that date. Voters chose representatives from all 435 congressional districts across each of the 50 U.S. states. Non-voting delegates from the District of Columbia and four of the five inhabited U.S. territories were also elected. These midterm elections took place nearly halfway through the second term of Democratic President Barack Obama. The winners served in the 114th United States Congress, with seats apportioned among the states based on the 2010 United States census. On Election Day, Republicans had held a House majority since January 2011 as a result of the 2010 elections.

The 2010 United States House of Representatives elections were held on November 2, 2010, with early voting taking place in some states in the weeks preceding that date. Voters chose representatives from all 435 congressional districts across each of the 50 U.S. states. Non-voting delegates from the District of Columbia and four of the five inhabited U.S. territories were also elected. These midterm elections took place nearly halfway through the first term of Democratic President Barack Obama. The winners served in the 112th United States Congress, with seats apportioned among the states based on the 2000 United States census. On Election Day, Democrats had held a House majority since January 2007 as a result of the 2006 elections.

The 2008 United States House of Representatives elections were held on November 4, 2008, with early voting taking place in some states in the weeks preceding that date. Voters chose representatives from all 435 congressional districts across each of the 50 U.S. states. Non-voting delegates from the District of Columbia and all five inhabited U.S. territories were also elected. These elections took place alongside the election of Democratic Senator Barack Obama of Illinois as President of the United States. The winners served in the 111th United States Congress, with seats apportioned among the states based on the 2000 United States census. On Election Day, Democrats had held a House majority since January 2007 as a result of the 2006 elections.

References

  1. "2006 Competitive House Race Chart" (PDF). House: Race Ratings. Cook Political Report. November 6, 2006. Archived from the original on September 27, 2007. Retrieved November 20, 2023.
  2. "2006 House Ratings". House Ratings. The Rothenberg Political Report. November 6, 2006. Archived from the original on November 7, 2006. Retrieved November 20, 2023.
  3. "2006 House". Sabato's Crystal Ball. November 6, 2006. Archived from the original on November 10, 2006. Retrieved November 20, 2023.
  4. "Battle for the House of Representatives". realclearpolitics.com. Real Clear Politics. November 7, 2006. Archived from the original on November 9, 2006. Retrieved December 12, 2023.
  5. "Balance of Power Scorecard: House". cqpolitics.com. Congressional Quarterly Inc. Archived from the original on November 17, 2006. Retrieved November 20, 2023.