2006 United States gubernatorial elections

Last updated

2006 United States gubernatorial elections
Flag of the United States.svg
  2005 November 7, 2006 2007  

38 governorships
36 states; 2 territories
 Majority partyMinority party
 
Party Democratic Republican
Seats before2228
Seats after2822
Seat changeIncrease2.svg 6Decrease2.svg 6
Seats up1422
Seats won2016

2006 United States gubernatorial elections results map.svg
Map of the results
     Republican hold
     Democratic hold     Democratic gain
     No election

United States gubernatorial elections were held on November 7, 2006, in 36 states and two territories. The elections coincided with the midterm elections of the United States Senate and the United States House of Representatives.

Contents

Democrats won open Republican-held governorships in Arkansas, Colorado, Massachusetts, New York, and Ohio; and they defeated Republican incumbent Bob Ehrlich in Maryland while retaining all of their seats, including their lone open seat in Iowa. Meanwhile, Republicans held open seats in Florida, Idaho, and Nevada, as well as Alaska, where incumbent governor Frank Murkowski was defeated in the primary. Voters in the United States territories of Guam (then-Republican) and the United States Virgin Islands (then-Democratic, but term-limited) also chose their governors and voters elected a new mayor for the District of Columbia, the District's chief executive.

As part of the 2006 Democratic sweep, Democrats did not lose a single incumbent or open seat to the Republicans in any congressional or gubernatorial contest. The results of the 2006 elections gave Republicans 22 governors to the Democrats' 28, a reversal of the numbers held by the respective parties prior to the elections. Republicans held the majority of governorships from 1995 until 2007.

As of 2024, this election marked the last time that the Democratic Party won gubernatorial elections in Iowa, Ohio, Oklahoma, Tennessee, or Wyoming. This is also the most recent gubernatorial election cycle in which the Republican Party won governorships in California, Connecticut, Hawaii, Minnesota, and Rhode Island to date.

Election ratings

StateIncumbentLast
race
Sabato
November 6,
2006
[1]
Rothenberg
November 2,
2006
[2]
Cook
November 6,
2006
[3]
RCP
November 6,
2006
[4]
Result
Alabama Bob Riley 49.2% RLikely RSafe RSafe RSafe R Riley
(57.5%)
Alaska Frank Murkowski 55.9% RLeans RLeans RTossupLeans R Palin
(48.3%)
Arizona Janet Napolitano 46.2% DSafe DSafe DSafe DSafe D Napolitano
(62.6%)
Arkansas Mike Huckabee
(Term-limited)
53.0% RLikely D (flip)Likely D (flip)Leans D (flip)Leans D (flip) Beebe
(55.6%)
California Arnold Schwarzenegger 48.6% RLikely RSafe RLeans RLikely R Schwarzenegger
(55.9%)
Colorado Bill Owens
(Term-limited)
62.6% RLikely D (flip)Likely D (flip)Likely D (flip)Likely D (flip) Ritter
(57.0%)
Connecticut Jodi Rell 56.1% RSafe RSafe RSafe RSafe R Rell
(63.2%)
Florida Jeb Bush
(Term-limited)
56.0% RLeans RLikely RLeans RLeans R Crist
(52.2%)
Georgia Sonny Perdue 51.4% RLikely RSafe RLeans RLikely R Perdue
(58.0%)
Hawaii Linda Lingle 51.6% RSafe RSafe RSafe RSafe R Lingle
(62.5%)
Idaho Jim Risch
(Retired)
56.3% RTossupLeans RTossupTossup Otter
(52.7%)
Illinois Rod Blagojevich 52.2% DLeans DLikely DLeans DLeans D Blagojevich
(49.8%)
Iowa Tom Vilsack
(Retired)
52.7% DLeans DLeans DTossupLeans D Culver
(54.0%)
Kansas Kathleen Sebelius 52.9% DLikely DSafe DSafe DLikely D Sebelius
(57.9%)
Maine John Baldacci 47.1% DLeans DLikely DLeans DLeans D Baldacci
(38.1%)
Maryland Bob Ehrlich 51.5% RLeans D (flip)Leans D (flip)TossupTossup O'Malley
(52.7%)
Massachusetts Mitt Romney
(Retired)
49.8% RLikely D (flip)Likely D (flip)Leans D (flip)Likely D (flip) Patrick
(55.6%)
Michigan Jennifer Granholm 51.4% DLeans DLikely DTossupLeans D Granholm
(56.4%)
Minnesota Tim Pawlenty 44.4% RTossupTossupTossupTossup Pawlenty
(46.7%)
Nebraska Dave Heineman 68.7% RSafe RSafe RSafe RSafe R Heineman
(73.4%)
Nevada Kenny Guinn
(Term-limited)
68.2% RLeans RTossupTossupLeans R Gibbons
(47.9%)
New Hampshire John Lynch 50.4% DSafe DSafe DSafe DSafe D Lynch
(74.0%)
New Mexico Bill Richardson 55.5% DSafe DSafe DSafe DSafe D Richardson
(68.8%)
New York George Pataki
(Retired)
49.4% RSafe D (flip)Likely D (flip)Safe D (flip)Safe D (flip) Spitzer
(65.7%)
Ohio Bob Taft
(Term-limited)
57.8% RLikely D (flip)Likely D (flip)Safe D (flip)Likely D (flip) Strickland
(60.5%)
Oklahoma Brad Henry 43.3% DSafe DSafe DSafe DSafe D Henry
(66.5%)
Oregon Ted Kulongoski 49.0% DTossupLeans DTossupLeans D Kulongoski
(50.7%)
Pennsylvania Ed Rendell 53.4% DSafe DSafe DSafe DLikely D Rendell
(60.3%)
Rhode Island Donald Carcieri 54.8% RLeans RLeans RTossupLikely R Carcieri
(51.0%)
South Carolina Mark Sanford 52.9% RLikely RSafe RLikely RSafe R Sanford
(55.1%)
South Dakota Mike Rounds 56.8% RSafe RSafe RSafe RSafe R Rounds
(61.7%)
Tennessee Phil Bredesen 50.6% DSafe DSafe DSafe DLikely D Bredesen
(68.6%)
Texas Rick Perry 57.8% RSafe RLikely RLikely RLikely R Perry
(39.0%)
Vermont Jim Douglas 58.7% RSafe RSafe RLikely RSafe R Douglas
(56.3%)
Wisconsin Jim Doyle 45.1% DLeans DTossupTossupLeans D Doyle
(52.8%)
Wyoming Dave Freudenthal 50.0% DSafe DSafe DSafe DSafe D Freudenthal
(70.0%)

Race summary

States

StateIncumbentPartyFirst
elected
ResultCandidates
Alabama Bob Riley Republican 2002 Incumbent re-elected.
Alaska Frank Murkowski Republican 2002 Incumbent lost renomination.
New governor elected.
Republican hold.
Arizona Janet Napolitano Democratic 2002 Incumbent re-elected.
Arkansas Mike Huckabee Republican1996 [lower-alpha 1] Incumbent term-limited.
New governor elected.
Democratic gain.
California Arnold Schwarzenegger Republican 2003 (recall) Incumbent re-elected.
Colorado Bill Owens Republican 1998 Incumbent term-limited.
New governor elected.
Democratic gain.
Connecticut Jodi Rell Republican2004 [lower-alpha 2] Incumbent elected to full term.
Florida Jeb Bush Republican 1998 Incumbent term-limited.
New governor elected.
Republican hold.
Georgia Sonny Perdue Republican 2002 Incumbent re-elected.
Hawaii Linda Lingle Republican 2002 Incumbent re-elected.
Idaho Jim Risch Republican2006 [lower-alpha 3] Incumbent retired.
New governor elected.
Republican hold.
Illinois Rod Blagojevich Democratic 2002 Incumbent re-elected.
Iowa Tom Vilsack Democratic 1998 Incumbent retired.
New governor elected.
Democratic hold.
Kansas Kathleen Sebelius Democratic 2002 Incumbent re-elected.
Maine John Baldacci Democratic 2002 Incumbent re-elected.
Maryland Bob Ehrlich Republican 2002 Incumbent lost re-election.
New governor elected.
Democratic gain.
Massachusetts Mitt Romney Republican 2002 Incumbent retired.
New governor elected.
Democratic gain.
Michigan Jennifer Granholm Democratic 2002 Incumbent re-elected.
Minnesota Tim Pawlenty Republican 2002 Incumbent re-elected.
Nebraska Dave Heineman Republican2005 [lower-alpha 4] Incumbent elected to full term.
Nevada Kenny Guinn Republican 1998 Incumbent term-limited.
New governor elected.
Republican hold.
New Hampshire John Lynch Democratic 2004 Incumbent re-elected.
New Mexico Bill Richardson Democratic 2002 Incumbent re-elected.
New York George Pataki Republican 1994 Incumbent retired.
New governor elected.
Democratic gain.
Ohio Bob Taft Republican 1998 Incumbent term-limited.
New governor elected.
Democratic gain.
Oklahoma Brad Henry Democratic 2002 Incumbent re-elected.
Oregon Ted Kulongoski Democratic 2002 Incumbent re-elected.
  • Green check.svgY Ted Kulongoski (Democratic) 50.7%
  • Ron Saxton (Republican) 42.7%
  • Mary Starrett (Constitution) 3.6%
  • Joe Keating (Pacific Green) 1.5%
  • Richard Morley (Libertarian) 1.2%
Pennsylvania Ed Rendell Democratic 2002 Incumbent re-elected.
Rhode Island Donald Carcieri Republican 2002 Incumbent re-elected.
South Carolina Mark Sanford Republican 2002 Incumbent re-elected.
South Dakota Mike Rounds Republican 2002 Incumbent re-elected.
Tennessee Phil Bredesen Democratic 2002 Incumbent re-elected.
Texas Rick Perry Republican2000 [lower-alpha 5] Incumbent re-elected.
Vermont Jim Douglas Republican 2002 Incumbent re-elected.
Wisconsin Jim Doyle Democratic 2002 Incumbent re-elected.
  • Green check.svgY Jim Doyle (Democratic) 52.8%
  • Mark Green (Republican) 45.4%
  • Nelson Eisman (Green) 1.9%
Wyoming Dave Freudenthal Democratic 2002 Incumbent re-elected.

Territories and federal district

TerritoryIncumbentPartyFirst
elected
ResultCandidates
District of Columbia Anthony A. Williams Democratic 1998 Incumbent retired.
New mayor elected.
Democratic hold.
  • Green check.svgY Adrian Fenty (Democratic) 89.7%
  • David Kranich (Republican) 6.1%
  • Chris Otten (Statehood Green) 4.1%
Guam Felix Perez Camacho Republican 2002 Incumbent re-elected.
U.S. Virgin Islands Charles Wesley Turnbull Democratic 1998 Incumbent term-limited.
New governor elected.
Democratic hold.

Closest races

States where the margin of victory was under 5%:

  1. Minnesota, 1.0%
  2. Rhode Island, 2.0%
  3. Guam, 2.3%
  4. Nevada, 4.0%

States where the margin of victory was under 10%:

  1. Maryland, 6.5%
  2. Florida, 7.1%
  3. Alaska, 7.4%
  4. Wisconsin, 7.5%
  5. Maine, 7.7%
  6. Oregon, 8.1%
  7. Idaho, 8.6%
  8. Texas, 9.2%
  9. Iowa, 9.4%

Red denotes states won by Republicans. Blue denotes states won by Democrats.

Alabama

Alabama gubernatorial election
Flag of Alabama.svg
  2002 November 7, 2006 2010  
  Governor Bob Riley (cropped).jpg Lucy Baxley.jpg
Nominee Bob Riley Lucy Baxley
Party Republican Democratic
Popular vote718,327 519,827
Percentage57.5%41.6%

2006 Alabama gubernatorial election results map by county.svg
County results
Riley:      40–50%     50–60%     60–70%     70–80%
Baxley:      40–50%     50–60%     60–70%     70–80%

Governor before election

Bob Riley
Republican

Elected Governor

Bob Riley
Republican

Incumbent Republican Bob Riley defeated Democratic Lieutenant Governor Lucy Baxley. Riley garnered 21% of African Americans' votes.

Alabama election [5]
PartyCandidateVotes%
Republican Bob Riley (incumbent) 718,327 57.45
Democratic Lucy Baxley 519,82741.57
Write-in 12,2470.98
Total votes1,250,401 100.00
Republican hold

Alaska

Alaska gubernatorial election
Flag of Alaska.svg
  2002 November 7, 2006 2010  
  Palin In Carson City On 13 September 2008.jpg Tony Knowles (D-AK) (cropped).jpg
Nominee Sarah Palin Tony Knowles Andrew Halcro
Party Republican Democratic Independent
Running mate Sean Parnell Ethan Berkowitz Fay Von Gemmingen
Popular vote114,69797,23822,443
Percentage48.3%41.0%9.5%

Alaska Governor Election Results by Boroughs, 2006.svg
Borough and census area results
Palin:     40–50%     50–60%     60–70%
Knowles:     40–50%     50–60%     60–70%     70–80%     80–90%

Governor before election

Frank Murkowski
Republican

Elected Governor

Sarah Palin
Republican

Governor Frank Murkowski, suffering poor approval ratings, was not favored to win renomination. An August 8 poll by Rasmussen Reports showed that going into the primary election his approval rating was at 27%, while his disapproval rating stood at 72%. Former Wasilla Mayor Sarah Palin and former state Railroad Commissioner John Binkley challenged Murkowski in the Republican primary. Former governor Tony Knowles was widely considered the favorite to win the Democratic nomination. In the primary held on August 22, Palin won the Republican nomination for governor with 51.1% of the vote, Binkley received 29.6%, and Murkowski received just 18.9% of the vote. [6] Knowles won the Democratic nomination with 68.6% of the vote; state representative Eric Croft, who received 23.1% of the vote, was his nearest competitor. [6]

Palin campaigned on a clean government platform in a state with a history of corruption. An October 15 CRG Research poll had the candidates tied at 43%. [7] An October 28 Rasmussen Reports poll showed Palin leading Knowles by a single percentage point. [7]

Republican nominee Sarah Palin was elected with 48.3% of the vote, a plurality.

Alaska election
PartyCandidateVotes%
Republican Sarah Palin 114,697 48.33
Democratic Tony Knowles 97,23840.97
Independent Andrew Halcro 22,4439.46
Independence Don Wright 1,2850.54
Libertarian Billy Toien6820.29
Green David Massie5930.25
Write-in 3840.16
Total votes238,307 100.00
Republican hold

Arizona

Arizona gubernatorial election
Flag of Arizona.svg
  2002 November 7, 2006 2010  
Turnout60.47% Increase2.svg 4.14pp [8]
  Portrait Napolitano hires crop.JPG Len Munsil.jpg
Nominee Janet Napolitano Len Munsil
Party Democratic Republican
Popular vote959,830543,528
Percentage62.6%35.4%

2006 Arizona gubernatorial election results map by county.svg
County results
Napolitano:      50–60%     60–70%     70–80%

Governor before election

Janet Napolitano
Democratic

Elected Governor

Janet Napolitano
Democratic

Incumbent Democratic Governor Janet Napolitano was re-elected in a landslide. Napolitano's widespread popularity contributed to her easy re-election; her general approval rating in October 2006, one month before the election, was at 58%. [9]

Arizona election [10]
PartyCandidateVotes%
Democratic Janet Napolitano (incumbent) 959,830 62.58
Republican Len Munsil 543,52835.44
Libertarian Barry Hess 30,2681.97
Write-in 190.00
Total votes1,533,645 100.00
Democratic hold

Arkansas

Arkansas gubernatorial election
Flag of Arkansas (1924-2011).svg
  2002 November 7, 2006 2010  
  MikeBeebe2009 (3x4a).JPG Asa Hutchinson 2006 (3x4c).jpg
Nominee Mike Beebe Asa Hutchinson
Party Democratic Republican
Popular vote430,765315,040
Percentage55.6%40.7%

2006 Arkansas gubernatorial election results map by county.svg
County results
Beebe:      40–50%     50–60%     60–70%     70–80%
Hutchinson:      40–50%     50–60%

Governor before election

Mike Huckabee
Republican

Elected Governor

Mike Beebe
Democratic

Governor Mike Huckabee was term-limited. The Republican Party nominated Asa Hutchinson, a former congressman, U.S. Attorney, DEA head, and Undersecretary of Homeland Security. The Democratic nominee was Arkansas Attorney General Mike Beebe. Beebe's campaign centered on what his campaign called his "Believe in Arkansas Plan", which outlined his plans for improving access to affordable healthcare, improving education, and stimulating economic development and job growth. Beebe led in most statewide polls, although his margin of victory in those polls varied wildly. Just days before the election, a Rasmussen Reports poll showed Beebe winning by just 8%, [11] while a SurveyUSA poll showed him winning by 20%. [12]

Democratic nominee Mike Beebe was elected with about 55.6% of the vote.

Arkansas election [13]
PartyCandidateVotes%
Democratic Mike Beebe 430,765 55.61
Republican Asa Hutchinson 315,04040.67
Independent Rod Bryan15,7672.04
Green Jim Lendall 12,7741.65
Write-in 3340.04
Total votes774,680 100.00
Democratic gain from Republican

California

California gubernatorial election
Flag of California.svg
  2003 (recall) November 7, 2006 2010  
Turnout32.77% Decrease2.svg28.43pp
  A. Schwarzenegger (3x4a).jpg Phil Angelides FCIC (3x4a).jpg
Nominee Arnold Schwarzenegger Phil Angelides
Party Republican Democratic
Popular vote4,850,1573,376,732
Percentage55.9%38.9%

2006 California gubernatorial election results map by county.svg
County results
Schwarzenegger:      40–50%     50–60%     60–70%     70–80%
Angelides:      40–50%     50–60%     60–70%

Governor before election

Arnold Schwarzenegger
Republican

Elected Governor

Arnold Schwarzenegger
Republican

Arnold Schwarzenegger won the 2003 recall election and replaced Gray Davis. Despite his failed special election and budget cuts, Arnold Schwarzenegger seemed to be ahead in the polls against Phil Angelides. Schwarzenegger's aggressive push for environment-friendly legislation, his support for stem cell research, gay rights and opposition to sending the National Guard to the border has made him very popular among the voters. Republican incumbent Arnold Schwarzenegger was re-elected.

California election [14]
PartyCandidateVotes%
Republican Arnold Schwarzenegger (incumbent) 4,850,157 55.88
Democratic Phil Angelides 3,376,73238.91
Green Peter Camejo 205,9952.37
Libertarian Art Olivier 114,3291.32
Peace and Freedom Janice Jordan 69,9340.81
American Independent Edward C. Noonan 61,9010.71
Write-in 3750.00
Total votes8,679,423 100.00
Republican hold

Colorado

Colorado gubernatorial election
Flag of Colorado.svg
  2002 November 7, 2006 2010  
  Bill Ritter official photo (cropped 2).jpg Beauprez.jpg
Nominee Bill Ritter Bob Beauprez
Party Democratic Republican
Popular vote887,986625,886
Percentage57.0%40.2%

Colorado Gubernatorial Election Results by County, 2006.svg
County results
Ritter:      40–50%     50–60%     60–70%     70–80%
Beauprez:      40–50%     50–60%     60–70%

Governor before election

Bill Owens
Republican

Elected Governor

Bill Ritter
Democratic

The retirement of term-limited Governor Bill Owens revealed divisions among the state's Republicans. Republican Congressman Bob Beauprez, widely regarded as a conservative, was attacked by his primary opponent, former University of Denver President Marc Holtzman for compromising with Democrats in Congress. Beauprez became the nominee when Holtzman failed to submit enough valid signatures to qualify for the ballot, but the negative attacks they exchanged damaged Beauprez's campaign. The Democratic nominee was former Denver District Attorney Bill Ritter, an anti-abortion Catholic and a political centrist who could not easily be portrayed as a liberal. Ritter did, however, support Referendum I and oppose Amendment 43; conversely, the public defeated the former and passed the latter. Ritter's campaign was boosted when he was endorsed by a group of Larimer County Republicans. During the period of January through August, Ritter raised almost twice as much as Beauprez. [15] According to an October 16 Zogby poll, Ritter led Beauprez 47% to 45%. [16] An October 22 SurveyUSA poll showed Ritter leading Beauprez by a larger margin, 56% to 38%. [17] Similarly, an October 22 Rasmussen Reports poll showed Ritter leading Beauprez, 51% to 39%. [18]

Democratic nominee Bill Ritter was elected with 57.0% of the vote.

Colorado election
PartyCandidateVotes%
Democratic Bill Ritter 888,095 56.99
Republican Bob Beauprez 625,88640.16
Libertarian Dawn Winkler23,3231.50
Independent Paul Fiorino10,9960.71
Constitution Clyde Harkins9,7160.62
Write-in 3890.02
Total votes1,558,405 100.00
Democratic gain from Republican

Connecticut

Connecticut gubernatorial election
Flag of Connecticut.svg
  2002 November 7, 2006 2010  
  FEMA - 29383 - Photograph by Debra Young taken on 04-19-2007 in Connecticut.jpg John DeStefano, Jr. in 2008 (cropped).jpg
Nominee Jodi Rell John DeStefano Jr.
Party Republican Democratic
Running mate Michael Fedele Mary Glassman
Popular vote710,048398,220
Percentage63.2%35.5%

2006 Connecticut gubernatorial election results map by county.svg
2006 Connecticut gubernatorial election results map by municipality.svg
Rell:     50–60%     60–70%     70–80%     80–90%
DeStefano:     50–60%     60–70%

Governor before election

Jodi Rell
Republican

Elected Governor

Jodi Rell
Republican

Incumbent Republican Jodi Rell became governor when John G. Rowland resigned on corruption charges in 2004. Rell had an approval rating of 70% as of October 19, 2006, [19] and polls showed her leading the Democratic nominee, New Haven mayor John DeStefano by a near 30-point margin. As expected, she won the election to a full term in a landslide. DeStefano defeated Stamford Mayor Dannel Malloy in the Connecticut Democratic gubernatorial primary on August 8.

Connecticut election [20]
PartyCandidateVotes%
Republican Jodi Rell (incumbent) 710,048 63.22
Democratic John DeStefano Jr. 398,22035.45
Green Cliff Thornton9,5840.85
Concerned Citizens Joseph A. Zdonczyk5,5600.49
Write-in 540.00
Total votes1,123,212 100.00
Republican hold

Florida

Florida gubernatorial election
Flag of Florida.svg
  2002 November 7, 2006 2010  
Turnout46.8%Decrease2.svg8.5 [21]
  Charlie Crist official portrait crop.jpg Jim Davis Congress.jpg
Nominee Charlie Crist Jim Davis
Party Republican Democratic
Running mate Jeff Kottkamp Daryl Jones
Popular vote2,519,8452,178,289
Percentage52.2%45.1%

2006 Florida gubernatorial election results map by county.svg
County results
Crist:      40–50%     50–60%     60–70%     70–80%
Davis:      40–50%     50–60%     60–70%

Governor before election

Jeb Bush
Republican

Elected Governor

Charlie Crist
Republican

Governor Jeb Bush was term-limited. Florida Attorney General Charlie Crist, a moderate, won the Republican primary with 64%, defeating the Chief Financial Officer of Florida, Tom Gallagher, who received only 34%. Congressman Jim Davis of Tampa won the Democratic primary with 47% of the vote, defeating State Senator Rod Smith of Alachua, who received 41% of the vote. In addition to Crist and Davis, Reform Party nominee Max Linn also appeared on the ballot in the general election.

Crist came out of the September 12 primary with momentum, but as the election drew closer, polls began to show a more competitive race. An October 23 Quinnipiac poll October 23 showed Crist's lead down to 2%. [22] However, an October 26 Rasmussen Reports poll had Crist leading Davis 52% to 41%. [23]

Republican nominee Charlie Crist was elected with 52.2% of the vote.

Florida election [24]
PartyCandidateVotes%
Republican Charlie Crist 2,519,845 52.20
Democratic Jim Davis 2,178,28945.10
Reform Max Linn92,5951.90
Independent John Wayne Smith15,9870.30
Independent Richard Paul Dembinsky11,9210.20
Independent Karl C.C. Behm10,4870.20
Write-in 1470.00
Total votes4,829,271 100.00
Republican hold

Georgia

Georgia gubernatorial election
Flag of Georgia (U.S. state).svg
  2002 November 7, 2006 2010  
  Sonny Perdue at rally.jpg Marktaylorpic (cropped).jpg
Nominee Sonny Perdue Mark Taylor
Party Republican Democratic
Popular vote1,229,724811,049
Percentage58.0%38.2%

2006 Georgia gubernatorial election results map by county.svg
County results
Perdue:      40–50%     50–60%     60–70%     70–80%     80–90%
Taylor:      40–50%     50–60%     60–70%     70–80%

Governor before election

Sonny Perdue
Republican

Elected Governor

Sonny Perdue
Republican

Incumbent Republican Governor Sonny Perdue ran for re-election to a second and final term as governor. Governor Perdue was renominated by the Republican Party, defeating a minor opponent in the process, while Lieutenant Governor Mark Taylor narrowly emerged victorious from a competitive Democratic primary. In the general election, though Taylor ran a spirited campaign, Perdue was aided by the increasing tendency of the state to vote for Republicans and by his popularity with the public; polling showed his approval ratings above sixty percent. In the end, Perdue was overwhelmingly re-elected as governor, defeating Taylor in a landslide, becoming the first Republican Governor of Georgia to ever be reelected.

Exit polls showed that Perdue won white voters (68% to 27%) while Taylor won black voters (81% to 17%). Perdue's 17% of the African-American vote was the highest showing of any Republican seeking statewide office in Georgia.

Georgia election [25]
PartyCandidateVotes%
Republican Sonny Perdue (incumbent) 1,229,724 57.95
Democratic Mark Taylor 811,04938.22
Libertarian Gary Hayes81,4123.84
Total votes2,122,185 100.00
Republican hold

Hawaii

2006 Hawaii gubernatorial election
Flag of Hawaii.svg
  2002 November 7, 2006 2010  
  Linda Lingle navy 1-cropped.jpg Randy Iwase.jpg
Nominee Linda Lingle Randy Iwase
Party Republican Democratic
Running mate Duke Aiona Malama Solomon
Popular vote215,313121,717
Percentage62.5%35.4%

2006 Hawaii gubernatorial election results map by county.svg
County results
Lingle:      50–60%     60–70%

Governor before election

Linda Lingle
Republican

Elected Governor

Linda Lingle
Republican

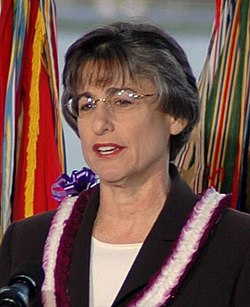
Although 2006 was a strong election year for Democrats, Incumbent Republican Governor Lingle won re-election by a landslide owing to an economic rebound in the state that occurred during her tenure after a shaky decade for the state economy during the 1990s and early 2000s.

Hawaii election [26]
PartyCandidateVotes%
Republican Linda Lingle (incumbent) 215,313 62.53
Democratic Randy Iwase 121,71735.35
Green James Brewer Jr.5,4351.58
Libertarian Ozell Daniel1,8500.54
Total votes344,315 100.00
Republican hold

Idaho

Idaho gubernatorial election
Flag of Idaho.svg
  2002 November 7, 2006 2010  
  Butchotter.jpg No image.svg
Nominee Butch Otter Jerry Brady
Party Republican Democratic
Popular vote237,437198,845
Percentage52.7%44.1%

2006 Idaho gubernatorial election results map by county.svg
County results
Otter:      50–60%     60–70%     70–80%
Brady:      40–50%     50–60%     60–70%

Governor before election

Jim Risch
Republican

Elected Governor

Butch Otter
Republican

Governor Jim Risch was elected Lieutenant Governor in 2002; in May 2006, he succeeded to the governorship when his predecessor, Dirk Kempthorne, resigned to become United States Secretary of the Interior. Before Kempthorne's appointment, Risch, a former Ada County District Attorney and state Senator, had committed to a reelection campaign for Lieutenant Governor, which meant the campaign for the governorship remained open.

Republican Congressman C.L. "Butch" Otter, a former lieutenant governor himself, was heavily favored to succeed Risch. On May 23 he easily won a four-way Republican primary, receiving 70% of the vote. In the general election, he faced newspaper publisher Jerry Brady, who was the Democratic nominee for the second consecutive gubernatorial election. Although Brady won the state's most populous county (Ada County, the location of Boise) in 2002, he was decisively defeated by Kempthorne statewide. He was expected to fare similarly against Otter; however, the race became fairly competitive, possibly due to a national trend towards the Democratic party.

Republican nominee Butch Otter was elected with 52.7% of the vote. Brady received 44.1%, making this gubernatorial election the closest in Idaho since 1994.

Idaho election [27]
PartyCandidateVotes%
Republican Butch Otter 237,437 52.67
Democratic Jerry Brady198,84544.11
Constitution Marvin Richardson 7,3091.62
Libertarian Ted Dunlap7,2411.61
Total votes450,832 100.00
Republican hold

Illinois

Illinois gubernatorial election
Flag of Illinois.svg
  2002 November 7, 2006 2010  
Turnout47.29% Decrease2.svg 2.76 pp
  Rod Blagojevich (2008).jpg President George W. Bush Greets Judy Baar Topinka, State Treasurer, Upon Arrival at Lincoln Airport in Springfield, Illinois (01) (cropped).jpg RichWhitney2 (cropped).jpg
Nominee Rod Blagojevich Judy Baar Topinka Rich Whitney
Party Democratic Republican Green
Running mate Pat Quinn Joe Birkett Julie Samuels
Popular vote1,736,7311,369,315361,336
Percentage49.8%39.3%10.4%

2006 Illinois gubernatorial election results map by county.svg
County results
Blagojevich:     30–40%     40–50%     50–60%     60–70%
Topinka:     30–40%     40–50%     50–60%     60–70%     70–80%

Governor before election

Rod Blagojevich
Democratic

Elected Governor

Rod Blagojevich
Democratic

Incumbent Rod Blagojevich proven to be an incredible fundraiser, and governed a relatively strong blue state. But recent opinion polling showed that his approval rating at a rather dismal 44%. [28] Blagojevich initially had the advantage in the general election, leading his Republican challenger, state Treasurer Judy Baar Topinka by eight percentage points in polls, although not reaching the fifty percent "safe zone" for incumbents. In March, Topinka won the GOP primary by 38% to 32% over dairy magnate Jim Oberweis. Meanwhile, a former Chicago Alderman named Edwin Eisendrath won a surprising 30% in the Democratic primary. During the election United States Attorney Patrick Fitzgerald was looking into the hiring practices of Governor Blagojevich. [29]

An October 15 Rasmussen Reports poll showed Blagojevich dropping 4 points, to end with 44% and Topinka staying at 36%. [30] An October 22 SurveyUSA poll had Blagojevich leading Topinka 44% to 34% with 8% undecided. [31] However, an October 31 Mason-Dixon poll showed Blagojevich leading Topinka only 44% to 40% with 9% undecided.

Democratic incumbent Rod Blagojevich was re-elected. Green Party candidate Rich Whitney showed one of the best showings of a third-party candidate in the 2006 election. Whitney received 361,336 votes, or 10% of the ballot share. This made the Green party an official major party in the state of Illinois.

Illinois election [32]
PartyCandidateVotes%
Democratic Rod Blagojevich (incumbent) 1,736,731 49.79
Republican Judy Baar Topinka 1,369,31539.26
Green Rich Whitney361,33610.36
Write-in 20,6070.59
Total votes3,487,989 100.00
Democratic hold

Iowa

Iowa gubernatorial election
Flag of Iowa (xrmap collection).svg
  2002 November 7, 2006 2010  
  Gov Chet Culver.jpg Jim Nussle small (cropped).jpg
Nominee Chet Culver Jim Nussle
Party Democratic Republican
Running mate Patty Judge Bob Vander Plaats
Popular vote569,021467,425
Percentage54.0%44.4%

2006 Iowa gubernatorial election results map by county.svg
County results
Culver:     40–50%     50–60%     60–70%
Nussle:     40–50%     50–60%     60–70%     70–80%     80–90%

Governor before election

Tom Vilsack
Democratic

Elected Governor

Chet Culver
Democratic

Congressman Jim Nussle was the Republican nominee, while the Democratic Party nominated Iowa Secretary of State Chet Culver, a progressive whose father was a U.S. Senator. An October 11 poll by Rasmussen Reports showed the candidates tied at 42% each. [33] An October 19 Rasmussen Reports poll had Culver leading Nussle 47% to 44%. [34]

The Democratic nominee, Chet Culver, was elected with 54.0% of the vote.
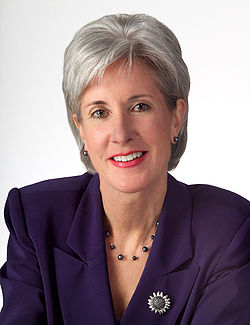
Iowa election [35]
PartyCandidateVotes%
Democratic Chet Culver 569,021 54.02
Republican Jim Nussle 467,42544.38
Green Wendy Barth7,8500.75
Libertarian Kevin Litten5,7350.54
Socialist Workers Mary Martin1,9740.19
Write-in 1,2500.12
Total votes1,053,255 100.00
Democratic hold

Kansas

Kansas gubernatorial election
Flag of Kansas.svg
  2002 November 7, 2006 2010  
  Sebeliusofficialphoto.jpg No image.svg
Nominee Kathleen Sebelius Jim Barnett
Party Democratic Republican
Running mate Mark Parkinson Susan Wagle
Popular vote491,993343,586
Percentage57.9%40.4%

2006 Kansas gubernatorial election results map by county.svg
County results
Sebelius:      40–50%     50–60%     60–70%     70–80%
Barnett:      40–50%     50–60%     60–70%

Governor before election

Kathleen Sebelius
Democratic

Elected Governor

Kathleen Sebelius
Democratic

Incumbent Democratic Governor Kathleen Sebelius, who sported high approval ratings [36] ran for re-election to serve a second and final term. Governor Sebelius was unopposed for the Democratic nomination and she faced the Republican nominee, State Senator Jim Barnett, who emerged from a crowded primary. Sebelius soundly defeated Barnett and cruised to re-election, which was quite a considerable feat for a Democrat in staunchly conservative Kansas.

Kansas election [37]
PartyCandidateVotes%
Democratic Kathleen Sebelius (incumbent) 491,993 57.90
Republican Jim Barnett 343,58640.44
Libertarian Carl Kramer8,8961.05
Reform Richard Lee Ranzau5,2210.61
Write-in 40.00
Total votes849,700 100.00
Democratic hold

Maine

Maine gubernatorial election
Flag of Maine.svg
  2002 November 7, 2006 2010  
  Governor John E. Baldacci at Kibby Mountain in Western Maine.jpg No image.svg
Nominee John Baldacci Chandler Woodcock
Party Democratic Republican
Popular vote209,927166,425
Percentage38.11%30.21%

 
Nominee Barbara Merrill Pat LaMarche
Party Independent Green
Popular vote118,71552,690
Percentage21.55%9.56%

2006 Maine gubernatorial election results map by county.svg
County results

Baldacci:     30–40%     40–50%

Woodcock:     30–40%     40–50%

Governor before election

John Baldacci
Democratic

Elected Governor

John Baldacci
Democratic

In February 2006, Baldacci was given a mere 41% approval rating by the voters of Maine in one poll. [38] But when the GOP unexpectedly nominated conservative state Senator Chandler Woodcock over the more moderate state Senator Peter Mills and former Congressman Dave Emery, Baldacci was handed a huge boost.

Polls consistently showed Baldacci with a small lead. An October 17 Rasmussen Reports poll had Baldacci with 44% and Woodcock at 34%. [39] Meanwhile, a Voice of the Voter poll [ permanent dead link ] announced by WCSH on November 6, one day before the election, gave John Baldacci his smallest lead yet with only 36%, with Senator Chandler Woodcock 30% and the now leading independent Barbara Merrill 22%, more than doubling her share. Green Independent candidate Pat LaMarche polled at 11%.

Baldacci was reelected with 38% of the vote compared to Woodcock's 30%, with 21.55% going to independent Barbara Merrill.

Maine election [40]
PartyCandidateVotes%
Democratic John Baldacci (incumbent) 209,927 38.11
Republican Chandler Woodcock 166,42530.21
Independent Barbara Merrill 118,71521.55
Green Pat LaMarche 52,6909.56
Independent Phillip Morris Napier3,1080.56
Total votes550,865 100.00
Democratic hold

Maryland

Maryland gubernatorial election
Flag of Maryland.svg
  2002 November 7, 2006 2010  
Turnout57.53% Decrease2.svg 4.32% [41]
  Martin O'Malley, photo portrait, visiting Maryland National Guard, June 8, 2008.jpg Robert ehrlich speaking at healthierUS summit cropped.jpg
Nominee Martin O'Malley Bob Ehrlich
Party Democratic Republican
Running mate Anthony Brown Kristen Cox
Popular vote942,279825,464
Percentage52.7%46.2%

2006 Maryland gubernatorial election results map by county.svg
County results
O'Malley:      40–50%     50–60%     60–70%     70–80%
Ehrlich:      50–60%     60–70%

Governor before election

Bob Ehrlich
Republican

Elected Governor

Martin O'Malley
Democratic

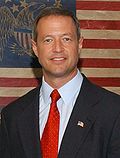
Bob Ehrlich's approval rating was 48%, which suggested a close election. Martin O'Malley, Mayor of Baltimore City, who was expected to run for governor almost as soon as the 2002 election was over, was initially expected to be a shoo-in for the Democratic nomination, but he was challenged by Montgomery County Executive Doug Duncan, who then unexpectedly dropped out of the race, citing a recent diagnosis of clinical depression, saving Democrats from a costly and potentially divisive primary.

A November 2 SurveyUSA poll had O'Malley leading Ehrlich 48% to 47% with 2% undecided. [42] A November 3 Mason-Dixon poll has O'Malley and Ehrlich tied at 45% with 9% undecided. [43] Democratic nominee Martin O'Malley was elected.

When Ehrlich unexpectedly beat his Democratic challenger, Lt. Governor Kathleen Kennedy in 2002, and became first Republican Governor of Maryland since Spiro T. Agnew, he was regarded by many as potential presidential candidate for 2008.

O'Malley defeated Ehrlich in the general election, 52.7% to 46.2%.

Maryland election [44]
PartyCandidateVotes%
Democratic Martin O'Malley 942,279 52.69
Republican Bob Ehrlich (incumbent)825,46446.16
Green Ed Boyd15,5510.87
Populist Christopher Driscoll3,4810.19
Write-in 1,5410.09
Total votes1,788,316 100.00
Democratic gain from Republican

Massachusetts

Massachusetts gubernatorial election
Flag of Massachusetts.svg
  2002 November 7, 2006 2010  
Turnout56.23% Increase2.svg 0.94 [45]
  Deval Patrick official photo (cropped).jpg Kerry Healey official Lieutenant Governor portrait (3x4a).jpg Christy Mihos, 2006.jpeg
Nominee Deval Patrick Kerry Healey Christy Mihos
Party Democratic Republican Independent
Running mate Tim Murray Reed V. Hillman John J. Sullivan
Popular vote1,234,984784,342154,628
Percentage55.0%35.0%6.9%

2006 Massachusetts gubernatorial election results map by county.svg
MA Governor 2006.svg
Patrick:     40–50%     50–60%     60–70%     70–80%     80–90%     >90%
Healey:     40–50%     50–60%
Tie:     40–50%

Governor before election

Mitt Romney
Republican

Elected Governor

Deval Patrick
Democratic

With his approval ratings down, Governor Mitt Romney opted not to seek a second term. Romney endorsed his lieutenant governor, Kerry Healey, in her bid to succeed him. Healey was unopposed in the Republican primary. Deval Patrick, a former U.S. Assistant Attorney General who headed the Department of Justice's Civil Rights Division, won the Democratic primary with 50% of the vote [46] against Thomas Reilly and Chris Gabrieli. Third-party candidates included Grace Ross of the Green-Rainbow Party and independent Christy Mihos, a former Republican and board member on the state Turnpike Authority. Over the course of the campaign, Patrick was the victim of several smears by the Healey campaign, including reports of his brother-in-law's criminal history that were leaked to the press.

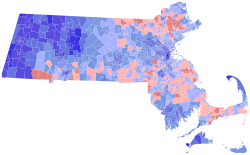
On November 7, Deval Patrick was elected with 56% of the vote. He became the first African American governor ever elected in the history of the state, and just the second in the nation's history (the first was Douglas Wilder, a Democrat from Virginia, who served as Governor of Virginia from 1990 to 1994). Patrick was also the first Democratic governor of Massachusetts since Michael Dukakis left office in 1991.

Massachusetts election [47]
PartyCandidateVotes%
Democratic Deval Patrick 1,234,984 55.64
Republican Kerry Healey 784,34235.33
Independent Christy Mihos 154,6286.97
Green-Rainbow Grace Ross 43,1931.95
Write-in 2,6320.12
Total votes2,219,779 100.00
Democratic gain from Republican

Michigan

Michigan gubernatorial election
Flag of Michigan.svg
  2002 November 7, 2006 2010  
Turnout50.7% Increase2.svg 7.2 [48]
  Jennifer Granholm 5.jpg Dick-DeVos-Nov-3-2006-Cropped.jpg
Nominee Jennifer Granholm Dick DeVos
Party Democratic Republican
Running mate John Cherry Ruth Johnson
Popular vote2,142,5131,608,086
Percentage56.4%42.3%

2006 Michigan gubernatorial election results map by county.svg
MI Governor 2006.svg
Granholm:      40–50%     50–60%     60–70%     70–80%     80–90%     >90%
DeVos:      40–50%     50–60%     60–70%     70–80%     80–90%
Tie:      40–50%
     No data

Governor before election

Jennifer Granholm
Democratic

Elected Governor

Jennifer Granholm
Democratic

Michigan, like many other Midwestern states, had been unable to take advantage of reported national economic and job growth. A string of plant and factory closings by big name companies such as General Motors in Granholm's state led to growing disapproval of her among voters. Opposing her was wealthy Republican businessman Dick DeVos. Throughout the race polls showed the election to be close, but in the last days Granholm pulled ahead. According to a November 1 EPIC-MRA poll, Granholm led DeVos 52% to 43% with 5% undecided. A November 4 SurveyUSA poll had Granholm leading DeVos 51% to 45%. [49] Ultimately, Democratic incumbent Jennifer Granholm was re-elected with 56.4 percent of the vote.

Michigan election [50]
PartyCandidateVotes%
Democratic Jennifer Granholm (incumbent) 2,142,513 56.36
Republican Dick DeVos 1,608,08642.30
Libertarian Greg Creswell 23,5240.62
Green Douglas Campbell20,0090.53
Constitution Bhagwan Dashairya7,0870.19
Write-in 370.00
Total votes3,801,256 100.00
Democratic hold

Minnesota

Minnesota gubernatorial election
Flag of Minnesota.svg
  2002 November 7, 2006 2010  
  Tim Pawlenty official photo.jpg MikeHatchMinnesota2006-08-21 crop.jpg No image.svg
Nominee Tim Pawlenty Mike Hatch Peter Hutchinson
Party Republican Democratic (DFL) Independence
Running mate Carol Molnau Judi Dutcher Maureen Reed
Popular vote1,028,5681,007,460141,735
Percentage46.7%45.7%6.4%

2006 Minnesota gubernatorial election results map by county.svg
MN Governor 2006.svg
Pawlenty:     40–50%     50–60%     60–70%     70–80%     80–90%     >90%
Hatch:     40–50%     50–60%     60–70%     70–80%     80–90%     >90%
Tie:     40–50%     50%
     No votes

Governor before election

Tim Pawlenty
Republican

Elected Governor

Tim Pawlenty
Republican

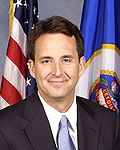
Pawlenty's approval rating was measured at 56% [38] on September 21, 2006. In 2002, Pawlenty won the governor's mansion with only 44% of the vote, facing a strong challenge from DFL Party candidate Roger Moe and Independence Party candidate Tim Penny, a former DFLer himself. Pawlenty has been criticized by some Minnesotans for budget cuts to programs such as MinnesotaCare to balance the budget (and controversial moves such as deferring required payments to the state's education and health care funds to later budget biennia to make the budget appear balanced when it was actually not). Pawlenty faces another strong DFL challenge this year in state Attorney General Mike Hatch, who fended off a liberal primary challenge from State Senator Becky Lourey. Pawlenty and Hatch were virtually neck and neck, with between 40-45% support for both candidates as recently as September, until the Mark Foley scandal hit the papers late that month, and 5-6% for Independence Party candidate Peter Hutchinson.

An October 23 SurveyUSA poll has Hatch leading Pawlenty 45% to 44% and Hutchinson with 7% . A November 1 Saint Cloud Times poll has Hatch at 46% and Pawlenty at 36%. [51] Republican incumbent Tim Pawlenty was re-elected.

Minnesota election [52]
PartyCandidateVotes%
Republican Tim Pawlenty (incumbent) 1,028,568 46.69
Democratic (DFL) Mike Hatch 1,007,46045.73
Independence Peter Hutchinson 141,7356.43
Green Ken Pentel10,8000.49
Independent Walt E. Brown9,6490.44
American Leslie Davis3,7760.17
Write-in 9490.04
Total votes2,202,937 100.00
Republican hold

Nebraska

Nebraska gubernatorial election
Flag of Nebraska.svg
  2002 November 7, 2006 2010  
  Dave Heineman official photo (cropped).jpg 3x4.svg
Nominee Dave Heineman David Hahn
Party Republican Democratic
Running mate Rick Sheehy Steve Loschen
Popular vote434,802144,624
Percentage73.4%24.5%

2006 Nebraska gubernatorial election results map by county.svg
2006 Nebraska Governor Election by Precinct.svg
Heineman:     40–50%     50–60%     60–70%     70–80%     80–90%     >90%
Hahn:     40–50%     50–60%     60–70%     70–80%     80–90%     >90%
Tie:     40–50%     50%
     No votes

Governor before election

Dave Heineman
Republican

Elected Governor

Dave Heineman
Republican

Primary elections were held on May 9, 2006. Republican incumbent Dave Heineman was elected to a full term, defeating Democrat David Hahn.

Nebraska election [53]
PartyCandidateVotes%
Republican Dave Heineman (incumbent) 435,507 73.40
Democratic David Hahn 145,11524.46
Nebraska Barry Richards8,9531.51
Independent Mort Sullivan3,7820.64
Total votes593,357 100.00
Republican hold

Nevada

Nevada gubernatorial election
Flag of Nevada.svg
  2002 November 7, 2006 2010  
  Jimgibbons.jpg Dina Titus official photo 2009 (cropped).jpg
Nominee Jim Gibbons Dina Titus
Party Republican Democratic
Popular vote279,003255,684
Percentage47.9%43.9%

2006 Nevada gubernatorial election results map by county.svg
County results
Gibbons:      50–60%     60–70%     70–80%
Titus:      40–50%

Governor before election

Kenny Guinn
Republican

Elected Governor

Jim Gibbons
Republican

Governor Kenny Guinn, a moderate Republican, was term-limited. His retirement resulted in competitive primaries in both parties. The Democratic nominee was State Senate Minority Leader Dina Titus, who won the primary with 54% of the vote over Henderson mayor Jim Gibson. The Republican nominee was Congressman Jim Gibbons, who won the primary with 48% of the vote, defeating state senator Bob Beers and Lieutenant Governor Lorraine Hunt. Gibbons, who then represented Nevada's 2nd congressional district, had a strong base in northern Nevada. Titus had a strong base in the Las Vegas Valley due to her legislative and education careers. An October 17 Rasmussen Reports poll put Gibbons ahead of Titus with a 51% to 43% lead. [54] Polls in late October conducted by Mason-Dixon and Research 2000 indicated that Gibbons was on track to win the election.

Republican nominee Jim Gibbons was elected with 48% of the vote, a plurality. Titus received 44% of the vote and Christopher H. Hansen, the nominee of the Independent American Party of Nevada, received about 3%.
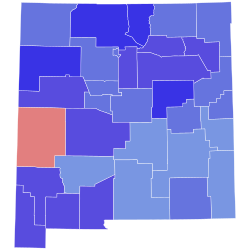
Nevada election [55]
PartyCandidateVotes%
Republican Jim Gibbons 279,003 47.93
Democratic Dina Titus 255,68443.92
None of These Candidates 20,6993.56
Independent American Christopher H. Hansen20,0193.44
Green Craig Bergland6,7531.16
Total votes582,158 100.00
Republican hold

New Hampshire

New Hampshire gubernatorial election
Flag of New Hampshire.svg
  2004 November 7, 2006 2008  
  John Lynch (cropped).jpg No image.svg
Nominee John Lynch Jim Coburn
Party Democratic Republican
Popular vote298,760104,288
Percentage74.0%25.8%

2006 New Hampshire gubernatorial election results map by county.svg
2006 New Hampshire gubernatorial election results map by municipality.svg
Lynch:     50–60%     60–70%     70–80%     80–90%     >90%
Coburn:     50–60%

Governor before election

John Lynch
Democratic

Elected Governor

John Lynch
Democratic

Incumbent Democrat John Lynch defeated Republican James B. Coburn and won a second term as Governor of New Hampshire.

Governor John Lynch campaign in New Hampshire Senator Joe Biden & Nozell-Thomas family (234370922).jpg
Governor John Lynch campaign in New Hampshire
New Hampshire election [56]
PartyCandidateVotes%
Democratic John Lynch 298,760 74.01
Republican Jim Coburn 104,28825.83
Write-in 6310.16
Total votes403,679 100.00
Democratic hold

New Mexico

New Mexico gubernatorial election
Flag of New Mexico.svg
  2002 November 7, 2006 2010  
  Bill Richardson at an event in Kensington, New Hampshire, March 18, 2006.jpg JOHN DENDAHL (170280092) (cropped).jpg
Nominee Bill Richardson John Dendahl
Party Democratic Republican
Running mate Diane Denish Sue Wilson Beffort
Popular vote384,806174,364
Percentage68.8%31.2%

2006 New Mexico gubernatorial election results map by county.svg
County results
Richardson:      50–60%     60–70%     70–80%     80–90%
Dendahl:      50–60%

Governor before election

Bill Richardson
Democratic

Elected Governor

Bill Richardson
Democratic

Incumbent Democratic Governor Bill Richardson was running for re-election. He faced Republican John Dendahl in the general election and won by a landslide.

New Mexico election [57]
PartyCandidateVotes%
Democratic Bill Richardson (incumbent) 384,806 68.82
Republican John Dendahl 174,36431.18
Total votes559,170 100.00
Democratic hold

New York

New York gubernatorial election
Flag of New York (1909-2020).svg
  2002 November 7, 2006 2010  
Turnout34.9% [58]
  Eliot Spitzer.jpg John Faso cropped.jpg
Nominee Eliot Spitzer John Faso
Party Democratic Republican
Alliance Conservative
Running mate David Paterson C. Scott Vanderhoef
Popular vote3,086,7091,274,335
Percentage65.3%27.1%

2006 New York gubernatorial election results map by county.svg
County results
Spitzer:      40–50%     50–60%     60–70%     70–80%     80–90%
Faso:      40–50%     50–60%

Governor before election

George Pataki
Republican

Elected Governor

Eliot Spitzer
Democratic

Governor George Pataki, a moderate Republican, opted not to seek a fourth term in office. Without an incumbent in the race, the Democratic nominee was heavily favored to win the election. New York Attorney General Eliot Spitzer won the Democratic primary with 81% of the vote, defeating Nassau County Executive Tom Suozzi. As attorney general, Spitzer became well known for prosecuting cases relating to corporate white-collar crime, securities fraud, internet fraud and environmental protection. The Republican nominee was attorney John Faso, a former New York State Assembly minority leader. Throughout the race, polls showed Spitzer defeating Faso by a large margin.

Democratic nominee Eliot Spitzer was elected in a landslide, winning 58 out of the state's 62 counties and taking 65.3% of the vote.

Gubernatorial election in New York, 2006 [59]
PartyCandidateRunning mateVotesPercentageSwing
Democratic Eliot Spitzer2,740,86458.34%Increase2.svg 26.84%
Independence Eliot Spitzer190,6614.06%Decrease2.svg 10.22%
Working Families Eliot Spitzer155,1843.30%Increase2.svg 1.32%
Total Eliot Spitzer David Paterson 3,086,70965.70%Increase2.svg32.20%
Republican John Faso1,105,68123.54%Decrease2.svg 22.00%
Conservative John Faso168,6543.59%Decrease2.svg 0.27%
Total John Faso C. Scott Vanderhoef1,274,33527.12%Decrease2.svg 22.28%
Green Malachy McCourt Brian Jones42,1660.89%Decrease2.svg 0.02%
Libertarian John Clifton Chris Edes14,7360.31%Increase2.svg 0.20%
Rent Is Too Damn High Jimmy McMillan None13,3550.28%N/A
Socialist Workers Maura DeLuca Ben O'Shaughnessy5,9190.13%N/A
Blank, Void, Scattering116,6225.55%
Majority1,812,37438.58%Increase2.svg 22.68%
Totals4,437,220100.00%
Democratic gain from Republican Swing

Ohio

Ohio gubernatorial election
Flag of Ohio.svg
  2002 November 7, 2006 2010  
  Tedstrickland (cropped).JPG Ken Blackwell 2011-02-11 (cropped).jpg
Nominee Ted Strickland Ken Blackwell
Party Democratic Republican
Running mate Lee Fisher Tom Raga
Popular vote2,435,3841,474,285
Percentage60.5%36.6%

2006 Ohio gubernatorial election results map by county.svg
2006 Ohio gubernatorial election by Congressional District.svg
Strickland:     40–50%     50–60%     60–70%     70–80%     80–90%
Blackwell:     40–50%     50–60%     60–70%

Governor before election

Bob Taft
Republican

Elected Governor

Ted Strickland
Democratic

Term-limited incumbent Governor Bob Taft was viewed as one of the most unpopular Governors in the history of Ohio. Polls showed his approval rating in the vicinity of 10% to 25%.

Congressman Ted Strickland won the Democratic primary with 79% of the vote, defeating state representative Bryan Flannery. The Republican primary, between Ohio Secretary of State Ken Blackwell and Ohio Attorney General Jim Petro, was more competitive by far. Petro came under fire for switching positions on same-sex marriage and abortion, as well as allegedly taking business from lawyers who refused to give him campaign contributions. [60] Blackwell and Petro also split over proposals to reduce state spending. Blackwell ultimately won the primary with 56% of the vote.

Blackwell was not a close ally of disgraced Governor Taft, but Taft's unpopularity still damaged his campaign. The negativity of the Republican primary also damaged Blackwell's general election campaign. In addition, in 2006 there was a nationwide trend towards the Democratic Party. An October 6 poll by Rasmussen Reports showed that Strickland led by 52% to 40%, a decline from September. [61] By contrast, an October 12 SurveyUSA poll had Strickland leading Blackwell 60% to 32%. [62]

Democratic nominee Ted Strickland was elected with 60.5% of the vote. He became the first Democratic Governor of Ohio since Dick Celeste.

Ohio election [63]
PartyCandidateVotes%
Democratic Ted Strickland 2,435,384 60.54
Republican Ken Blackwell 1,474,28536.65
Libertarian Bill Peirce71,4681.78
Green Bob Fitrakis 40,9651.02
Write-in 6520.02
Total votes4,022,754 100.00
Democratic gain from Republican

Oklahoma

Oklahoma gubernatorial election
Flag of Oklahoma.svg
  2002 November 7, 2006 2010  
  BradhenryDEA.jpg ErnestIstook.jpg
Nominee Brad Henry Ernest Istook
Party Democratic Republican
Popular vote616,135310,327
Percentage66.5%33.5%

2006 Oklahoma gubernatorial election results map by county.svg
County results
Henry:      50–60%     60–70%     70–80%     80–90%
Istook:      50–60%     60–70%

Governor before election

Brad Henry
Democratic

Elected Governor

Brad Henry
Democratic

Incumbent Democratic Governor Brad Henry won re-election to a second term in a landslide, defeating Republican U.S. Representative Ernest Istook. Henry took 66.5% of the vote to Istook's 33.5% and swept all but three counties in the state. [64]

Oklahoma election [65]
PartyCandidateVotes%
Democratic Brad Henry (incumbent) 616,135 66.50
Republican Ernest Istook 310,32733.50
Total votes926,462 100.00
Democratic hold

Oregon

Oregon gubernatorial election
Flag of Oregon.svg
  2002 November 7, 2006 2010  
  Ted Kulongoski headshot Color 2007 (cropped).JPG No image.svg
Nominee Ted Kulongoski Ron Saxton
Party Democratic Republican
Popular vote699,786589,748
Percentage50.7%42.8%

2006 Oregon gubernatorial election results map by county.svg
County results

Kulongoski:     40–50%     50–60%     60–70%

Saxton:     40–50%     50–60%     60–70%     70–80%

Governor before election

Ted Kulongoski
Democratic

Elected Governor

Ted Kulongoski
Democratic

Democratic Governor Ted Kulongoski was elected in 2002 barely defeating former State Representative Kevin Mannix. Kulongoski leads his challenger, former Portland Public School Board member Ron Saxton 51% to 44%. [66] Oregon has not elected a Republican as governor since 1982, when Kulongoski lost to then-Governor Victor Atiyeh. Democratic incumbent Ted Kulongoski was re-elected.

Oregon election [67]
PartyCandidateVotes%
Democratic Ted Kulongoski (incumbent) 699,786 50.73
Republican Ron Saxton 589,74842.75
Constitution Mary Starrett50,2293.64
Pacific Green Joe Keating20,0301.45
Libertarian Richard Morley16,7981.22
Write-in 2,8840.21
Total votes1,379,475 100.00
Democratic hold

Pennsylvania

Pennsylvania gubernatorial election
Flag of Pennsylvania.svg
  2002 November 7, 2006 2010  
  Ed Rendell ID2004 crop (cropped).JPG Lynn Swann official photo (cropped).jpg
Nominee Ed Rendell Lynn Swann
Party Democratic Republican
Running mate Catherine Baker Knoll Jim Matthews
Popular vote2,470,5171,622,135
Percentage60.4%39.6%

2006 Pennsylvania gubernatorial election results map by county.svg
2006 Pennsylvania gubernatorial election results map by congressional district.svg
PA 2006 Governor Election By Precinct.svg
Swann:      50–60%     60–70%     70–80%     80–90%     >90%
Rendell:      50–60%     60–70%     70–80%     80–90%     >90%
Tie:      50%
     No data

Governor before election

Ed Rendell
Democratic

Elected Governor

Ed Rendell
Democratic

Incumbent Democratic Governor Ed Rendell successfully ran for re-election. Pennsylvania's first female lieutenant governor, Catherine Baker Knoll, was also running for re-election.

Pennsylvania election [68]
PartyCandidateVotes%
Democratic Ed Rendell (incumbent) 2,470,517 60.33
Republican Lynn Swann 1,622,13539.61
Write-in 2,6700.06
Total votes4,095,322 100.00
Democratic hold

Rhode Island

Rhode Island gubernatorial election
Flag of Rhode Island.svg
  2002 November 7, 2006 2010  
  Donald Carcieri (cropped).jpg No image.svg
Nominee Donald Carcieri Charles J. Fogarty
Party Republican Democratic
Popular vote197,306189,503
Percentage51.0%49.0%

2006 Rhode Island gubernatorial election results map by county.svg
2006 Rhode Island gubernatorial election results map by municipality.svg
Carcieri:     50–60%     60–70%     70–80%
Fogarty:     50–60%     60–70%     70–80%

Governor before election

Donald Carcieri
Republican

Elected Governor

Donald Carcieri
Republican

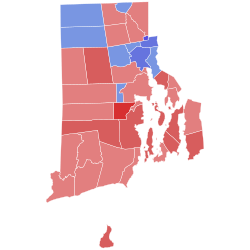
Polling in the race showed Donald Carcieri, Republican governor in one of the most liberal states in the country, running even with his Democratic challenger, Lieutenant Governor Charles J. Fogarty. [69] Carcieri was re-elected with 51% of the vote.

Rhode Island election [70]
PartyCandidateVotes%
Republican Donald Carcieri (incumbent) 197,306 51.01
Democratic Charles J. Fogarty 189,50348.99
Total votes386,809 100.00
Republican hold

South Carolina

South Carolina gubernatorial election
Flag of South Carolina.svg
  2002 November 7, 2006 2010  
  Mark Sanford 113th Congressional portrait.jpg 3x4.svg
Nominee Mark Sanford Tommy Moore
Party Republican Democratic
Popular vote601,868489,076
Percentage55.1%44.8%

2006 South Carolina gubernatorial election results map by county.svg
County results
Sanford:      50–60%     60–70%
Moore:      50–60%     60–70%     70–80%

Governor before election

Mark Sanford
Republican

Elected Governor

Mark Sanford
Republican

Incumbent Republican Governor Mark Sanford won re-election against Democratic State Senator Tommy Moore, becoming only the third Republican governor in South Carolina to win a second term (Robert Kingston Scott and Carroll A. Campbell Jr. were the others). Sanford started the campaign with a double-digit edge over Moore and he maintained that lead to election day. During the course of the campaign, Sanford's approval rating averaged in the mid-fifties. [71] In Sanford's re-election victory, he also garnered 22% of the African American vote.

South Carolina election
PartyCandidateVotes%
Republican Mark Sanford (incumbent) 601,868 55.12
Democratic Tommy Moore 489,07644.79
Write-in 1,0080.09
Total votes1,091,952 100.00
Republican hold

South Dakota

South Dakota gubernatorial election
Flag of South Dakota.svg
  2002 November 7, 2006 2010  
  Mike Rounds official photo.JPG No image.svg
Nominee Mike Rounds Jack Billion
Party Republican Democratic
Running mate Dennis Daugaard Eric Abrahamson
Popular vote206,990121,226
Percentage61.7%36.1%

2006 South Dakota gubernatorial election results map by county.svg
County results

Rounds:     50–60%     60–70%     70-80%     80–90%

Billion:     40–50%     50–60%     60–70%

Governor before election

Mike Rounds
Republican

Elected Governor

Mike Rounds
Republican

Incumbent Republican Governor Mike Rounds defeated Democrat Jack Billion to serve a second term as governor.

South Dakota election [72]
PartyCandidateVotes%
Republican Mike Rounds (incumbent) 206,990 61.69
Democratic Jack Billion 121,22636.13
Constitution Steven J. Willis4,0101.20
Libertarian Tom Gerber3,2820.98
Total votes335,508 100.00
Republican hold

Tennessee

Tennessee gubernatorial election
Flag of Tennessee.svg
  2002 November 7, 2006 2010  
Turnout49.97% Decrease2.svg [73] 0.43 pp
  Governor Bredesen (cropped).jpg Jim Bryson Tennessee.jpg
Nominee Phil Bredesen Jim Bryson
Party Democratic Republican
Popular vote1,247,491540,853
Percentage68.6%29.7%

2006 Tennessee gubernatorial election results map by county.svg
County results
Bredesen:      50–60%     60–70%     70–80%     80–90%

Governor before election

Phil Bredesen
Democratic

Elected Governor

Phil Bredesen
Democratic

Incumbent Democratic Governor Phil Bredesen defeated Republican State Senator Jim Bryson in a landslide with 68.6% of the vote, winning every county in the state.

Primary elections were held on August 3, 2006.

As of 2024, this was the last time a Democrat won a majority of counties in the state, the last time a Democrat won any statewide race in Tennessee, and the most recent statewide election in Tennessee in which 88 of the state's 95 counties, including Knox County and Hamilton County, went to the Democratic candidate. Only Davidson, Shelby, Haywood, Hardeman, Houston, Jackson, and Lake counties have voted for a Democratic candidate in a Presidential, Senate, or gubernatorial race since 2006, with Jackson and Lake only going Democratic once. Eight years later, Republican Governor Bill Haslam won every county in the state when he won re-election. This marked a sharp political shift in Tennessee.

Tennessee election [74]
PartyCandidateVotes%
Democratic Phil Bredesen (incumbent) 1,247,491 68.60
Republican Jim Bryson 540,85329.74
Independent Carl Two Feathers Whitaker11,3740.63
Independent George Banks7,5310.41
Independent Charles E. Smith4,0830.22
Independent Howard W. Switzer2,7110.15
Independent David Gatchell2,3850.13
Independent Marivuana Stout Leinoff2,1140.12
Write-in 70.00
Total votes1,818,549 100.00
Democratic hold

Texas

Texas gubernatorial election
Flag of Texas.svg
  2002 November 7, 2006 2010  
  RickPerry2006 (1).jpg Bell photo.jpg
Nominee Rick Perry Chris Bell
Party Republican Democratic
Popular vote1,716,8031,310,353
Percentage39.0%29.8%

  Carole Keeton Strayhorn (1).jpg Kinky Friedman portrait (21610) (cropped).jpg
Nominee Carole Keeton Strayhorn Kinky Friedman
Party Independent Independent
Popular vote797,577546,869
Percentage18.1%12.4%

2006 Texas gubernatorial election results map by county.svg
County results

Perry:     20–30%     30–40%     40–50%     50–60%     60–70%
Bell:     30–40%     40–50%     50–60%     60–70%

Strayhorn:     20–30%     30–40%     40–50%

Governor before election

Rick Perry
Republican

Elected Governor

Rick Perry
Republican

Challenges from two popular independents, coupled with Perry's mediocre approval ratings, made the race interesting. Populist state Comptroller Carole Keeton Strayhorn decided to defect from the GOP and run against Perry, her bitter political foe, as an independent. Six weeks after the announcement of her candidacy, she moved to within single digits of Perry in polls. In addition to Perry and Strayhorn, former Congressman Chris Bell ran as the Democratic candidate, with country singer and Texas icon Kinky Friedman as another independent. This resulted in a peculiar four-way race (technically, a six-way race including the Libertarian candidate and a write-in candidate) in which no run-off would take place. Perry was elected to a second full term with just 39% of the vote.

Texas election [75]
PartyCandidateVotes%
Republican Rick Perry (incumbent) 1,716,803 39.03
Democratic Chris Bell 1,310,35329.79
Independent Carole Keeton Strayhorn 797,57718.13
Independent Kinky Friedman 546,86912.43
Libertarian James Werner26,7480.61
Write-in 7180.02
Total votes4,399,068 100.00
Republican hold

Vermont

Vermont gubernatorial election
Flag of Vermont.svg
  2004 November 7, 2006 2008  
  Jim Douglas-2009 (cropped).jpg Scudder Parker.jpg
Nominee Jim Douglas Scudder Parker
Party Republican Democratic
Popular vote148,014108,090
Percentage56.3%41.1%

2006 Vermont gubernatorial election results map by county.svg
2006 Vermont gubernatorial election results map by municipality.svg
Douglas:     40–50%     50–60%     60–70%     70–80%     80–90%
Parker:     40–50%     50–60%     60–70%     70–80%

Governor before election

Jim Douglas
Republican

Elected Governor

Jim Douglas
Republican

Incumbent Republican Governor Jim Douglas won re-election to a third term, defeating Democratic nominee Scudder Parker.

Vermont election [76]
PartyCandidateVotes%
Republican Jim Douglas (incumbent) 148,014 56.38
Democratic Scudder Parker 108,09041.17
Independent Cris Ericson 2,4770.94
Green Jim Hogue1,9360.74
Independent Benjamin Clarke1,2160.46
Liberty Union Robert Skold6380.24
Write-in 1530.06
Total votes262,524 100.00
Republican hold

Wisconsin

Wisconsin gubernatorial election
Flag of Wisconsin.svg
  2002 November 7, 2006 2010  
  Jim Doyle (3x4) a.jpg MarkGreen (3x4) a.jpg
Nominee Jim Doyle Mark Green
Party Democratic Republican
Popular vote1,139,115979,427
Percentage52.7%45.3%

2006 Wisconsin gubernatorial election results map by county.svg
WI Governor 2006.svg
Doyle:      30–40%     40–50%     50–60%     60–70%     70–80%     80–90%     >90%
Green:      40–50%     50–60%     60–70%     70–80%     80–90%     >90%
Tie:      40–50%     50%
     No data

Governor before election

Jim Doyle
Democratic

Elected Governor

Jim Doyle
Democratic

In 2002, Doyle was elected with only 45 percent of the vote because of an unusually strong challenge from the Libertarian party. Although his early 2006 approval rating was a mildly unfavorable 45 percent, he led both Republican challengers, Milwaukee County Executive Scott Walker and Congressman Mark Green by six to nine points in polls; he has not been able to poll greater than fifty percent. Green got a big break when Walker dropped out of the race. And more recent polls show that Green has pulled even. Wisconsin is a swing state in the strongest sense, with George W. Bush losing the state by some 5,700 votes in 2000 and around 12,400 votes in 2004, although they hadn't voted for a Republican for president since 1984, and they hadn't had a Republican senator since 1993. An October 18 Rasmussen Reports poll has Doyle leading Green 48% to 44% [77] and an October 31 Research 2000 poll has Doyle leading Green 50% to 44%. [78] Democratic incumbent Jim Doyle was re-elected.

Wisconsin election [79]
PartyCandidateVotes%
Democratic Jim Doyle (incumbent) 1,139,115 52.76
Republican Mark A. Green 979,42745.36
Green Nelson Eisman40,7091.89
Total votes2,159,251 100.00
Democratic hold

Wyoming

2006 Wyoming gubernatorial election
Flag of Wyoming.svg
  2002 November 7, 2006 2010  
  Dave Freudenthal speech.jpg 3x4.svg
Nominee Dave Freudenthal Ray Hunkins
Party Democratic Republican
Popular vote135,51658,100
Percentage70.0%30.0%

2006 Wyoming gubernatorial election results map by county.svg
County results
Freudenthal:      50–60%     60–70%     70–80%     80–90%

Governor before election

Dave Freudenthal
Democratic

Elected Governor

Dave Freudenthal
Democratic

Incumbent Democratic Governor Dave Freudenthal won re-election in a landslide over Republican Ray Hunkins, becoming the first Democrat since 1910 to win every county in the state. To date this was the last time a Democrat was elected to statewide office in Wyoming, the last time a Democrat carried every county in the state, the last gubernatorial election in which a Democrat received more than 30% of the vote, and the last statewide election in which a Democrat received more than 45% of the vote.

Wyoming election [80]
PartyCandidateVotes%
Democratic Dave Freudenthal (incumbent) 135,516 69.99
Republican Ray Hunkins58,10030.01
Total votes193,616 100.00
Democratic hold

Territories and federal district

District of Columbia

District of Columbia mayoral election
Flag of Washington, D.C.svg
  2002 November 7, 2006 2010  
  Adrian Fenty, Mayor of DC, November 5, 2007 (1).jpg 3x4.svg
Nominee Adrian Fenty David Kranich
Party Democratic Republican
Popular vote98,7406,744
Percentage89.7%6.1%

District of Columbia mayoral election results by ward, 2006.svg
Results by ward:
  Fenty—>90%
  Fenty—80–90%

Mayor before election

Anthony A. Williams
Democratic

Elected Mayor

Adrian Fenty
Democratic

The Democratic primary was held on September 12. The winner of that and general election was Adrian Fenty, the representative for Ward 4 on the D.C. Council. He took office on January 2, 2007, becoming the sixth directly elected mayor since the establishment of home rule in the District, and — at 35 — the youngest elected mayor of a major American city in U.S. history.

Washington, D.C. election [81]
PartyCandidateVotes%
Democratic Adrian Fenty 98,740 89.73
Republican David Kranich6,7446.13
DC Statehood Green Chris Otten4,5544.14
Total votes110,038 100.00
Democratic hold

Guam

Guamanian gubernatorial election
Flag of Guam.svg
  2002 November 7, 2006 2010  
  Guam Governor Felix Camacho.jpg Underwood-GUal (cropped).jpg
Nominee Felix Perez Camacho Robert Underwood
Party Republican Democratic
Running mate Michael Cruz Frank Aguon
Popular vote19,56018,700
Percentage50.25%48.04%

Governor before election

Felix Perez Camacho
Republican

Elected Governor

Felix Perez Camacho
Republican

In the U.S. territory of Guam, in the western Pacific Ocean, Republican Governor Felix P. Camacho was challenged by Democrat Robert Underwood. A former Guam Delegate-at-Large in the U.S. House of Representatives, Underwood had previously represented Guam from 1993 to 2003. The race was a rematch of the 2002 gubernatorial election in which Camacho handily defeated Underwood and won his first term in office by 10 points (see Politics of Guam). However, the race was significantly more close and competitive in 2006, with Camacho narrowly winning re-election by a 2-point margin over Underwood.

Guam election
PartyCandidateVotes%
Republican Felix Perez Camacho (incumbent) 19,560 50.25
Democratic Robert A. Underwood 18,70048.04
Write-in 6681.72
Total votes38,928 100.00
Republican hold

U.S. Virgin Islands

2006 United States Virgin Islands gubernatorial election
Flag of the United States Virgin Islands.svg
  2002 November 7, 2006 (first round)
November 21, 2006 (runoff)
2010  
Turnout29,046
  Governor John de Jongh - United States Virgin Islands (cropped).jpg Kenneth Ezra Mapp (cropped).png
Nominee John de Jongh Kenneth Mapp
Party Democratic Independent
Running mate Gregory Francis Almando Liburd
Popular vote16,64412,402
Percentage57.3%42.7%

Governor before election

Charles Wesley Turnbull
Democratic

Elected Governor

John de Jongh
Democratic

U.S. Virgin Islands election
PartyCandidateVotes%
Democratic John de Jongh Jr. 16,644 57.30
Independent Kenneth Mapp 12,40242.70
Total votes29,046 100.00
Democratic hold

See also

Notes

  1. Huckabee took office after his predecessor (Jim Guy Tucker) resigned. He was subsequently elected in the 1998 Arkansas gubernatorial election.
  2. Rell took office after her predecessor (John G. Rowland) resigned.
  3. Risch took office after his predecessor (Dirk Kempthorne) resigned.
  4. Heineman took office after his predecessor (Mike Johanns) resigned.
  5. Perry took office after his predecessor (George W. Bush) resigned. He was subsequently elected in the 2002 Texas gubernatorial election.

Related Research Articles

<span class="mw-page-title-main">2006 United States Senate elections</span>

The 2006 United States Senate elections were held on November 7, 2006, with all 33 Class 1 Senate seats being contested. The term of office for those elected in 2006 ran from January 3, 2007, to January 3, 2013. Prior to the election cycle, the Republican Party controlled 55 of the 100 Senate seats.

<span class="mw-page-title-main">2008 United States Senate elections</span>

The 2008 United States Senate elections were held on November 4, 2008, with 35 of the 100 seats in the Senate being contested. Thirty-three seats were up for regular elections; the winners were eligible to serve six-year terms from January 3, 2009, to January 3, 2015, as members of Class 2. There were also two special elections, the winners of those seats would finish the terms that ended on January 3, 2013. The presidential election, which was won by Democrat Barack Obama, elections for all House of Representatives seats; elections for several gubernatorial elections; and many state and local elections occurred on the same date.

<span class="mw-page-title-main">2010 United States Senate elections</span>

The 2010 United States Senate elections were held on November 2, 2010, from among the United States Senate's 100 seats. A special election was held on January 19, 2010, for a mid-term vacancy in Massachusetts. Thirty-four of the November elections were for six-year terms to the Senate's Class 3, while other three were special elections to finish incomplete terms. Those 37 November elections featured 19 incumbent Democrats and 18 incumbent Republicans.

<span class="mw-page-title-main">2006 Illinois gubernatorial election</span>

The 2006 Illinois gubernatorial election took place on November 7, 2006. Incumbent Democratic Governor Rod Blagojevich won re-election to a second four-year term scheduled to have ended on January 10, 2011. However, Blagojevich did not complete his term, as he was impeached and removed from office in 2009. This was the first election since 1964 that a Democrat was re-elected governor.

<span class="mw-page-title-main">2006 Maryland gubernatorial election</span> Election for governor of Maryland, U.S.

The 2006 Maryland gubernatorial election was held on November 7, 2006. Incumbent Republican Governor Bob Ehrlich ran for a second term, but was defeated by the Democratic nominee, Baltimore Mayor Martin O'Malley. Ehrlich was the only incumbent governor from either party to lose a general election in the 2006 midterms.

<span class="mw-page-title-main">2006 California gubernatorial election</span>

The 2006 California gubernatorial election occurred on November 7, 2006. The primary elections took place on June 6, 2006. The incumbent Republican Governor, Arnold Schwarzenegger, won re-election for his first and only full term. His main opponent was California State Treasurer Phil Angelides, the California Democratic Party nominee. Peter Camejo was the California Green Party nominee, Janice Jordan was the Peace and Freedom Party nominee, Art Olivier was the California Libertarian Party nominee, and Edward C. Noonan was the California American Independent Party nominee.

<span class="mw-page-title-main">2006 Texas gubernatorial election</span> Election for the governorship of the U.S. state of Texas

The 2006 Texas gubernatorial election was held on November 7, 2006, to elect the governor of Texas. The election was a rare five-way race, with incumbent Republican Governor Rick Perry running for re-election against Democrat Chris Bell and Independents Carole Keeton Strayhorn and Kinky Friedman, as well as Libertarian nominee James Werner.

<span class="mw-page-title-main">2006 Colorado gubernatorial election</span>

The 2006 Colorado gubernatorial election was held on November 7, 2006. Incumbent Republican governor Bill Owens was unable to run due to term limits, and the election was won by Democratic nominee Bill Ritter.

<span class="mw-page-title-main">2006 Connecticut gubernatorial election</span>

The 2006 Connecticut gubernatorial election occurred on November 7, 2006. Incumbent Republican Jodi Rell became governor when John G. Rowland resigned on corruption charges in 2004. Rell had an approval rating of 70% as of October 19, 2006, and polls showed her leading the Democratic nominee, New Haven mayor John DeStefano by a near 30-point margin. As expected, she won the election to a full term in a landslide. DeStefano defeated Stamford Mayor Dannel Malloy in the Connecticut Democratic gubernatorial primary on August 8. As of 2024, this was the last time a Republican was elected Governor of Connecticut, and the last time any gubernatorial candidate won every county in the state.

<span class="mw-page-title-main">2006 United States Senate election in Pennsylvania</span> Class I U.S. Senate election in Pennsylvania

The 2006 United States Senate election in Pennsylvania was held on November 7, 2006. Incumbent Republican Rick Santorum ran for re-election to a third term, but was defeated by Democratic State Treasurer Bob Casey, Jr., the son of former Pennsylvania governor Bob Casey Sr. Casey was elected to serve between January 3, 2007 and January 3, 2013.

<span class="mw-page-title-main">2008 United States gubernatorial elections</span>

United States gubernatorial elections were held on November 4, 2008, in 11 states and two territories. Prior to the election, eight of the total seats were held by Democrats and five by Republicans. Two governors were prohibited by term limits from seeking re-election in 2008. The only governorship to change party was the open seat in Missouri, which was won by a Democrat after being previously held by a Republican.

<span class="mw-page-title-main">2002 United States gubernatorial elections</span>

United States gubernatorial elections were held on November 5, 2002, in 36 states and two territories. The Republicans won eight seats previously held by the Democrats, as well as the seat previously held by Minnesota governor Jesse Ventura, who was elected on the Reform Party ticket but had since renounced his party affiliation. The Democrats won 10 seats previously held by the Republicans, as well as the seat previously held by Maine governor Angus King, an independent. The elections were held concurrently with the other United States elections of 2002.

<span class="mw-page-title-main">2000 United States gubernatorial elections</span>

United States gubernatorial elections were held on November 7, 2000, in 11 states and two territories. The elections coincided with the presidential election. Democrats gained one seat by defeating an incumbent in West Virginia. As of 2024, this remains the last gubernatorial cycle in which a Democrat won in Indiana.

<span class="mw-page-title-main">2008 Missouri gubernatorial election</span> Election for the governorship of the U.S. state of Missouri

The 2008 Missouri gubernatorial election was held on November 4, 2008. Incumbent Republican Governor Matt Blunt decided to retire instead of seeking reelection to a second term in office. Democratic nominee Jay Nixon won the open seat, defeating Republican nominee Kenny Hulshof.

<span class="mw-page-title-main">2010 United States gubernatorial elections</span>

United States gubernatorial elections were held on November 2, 2010, in 37 states and two territories. These elections coincided with the elections for the United States Senate and the United States House of Representatives as well as other state and local elections. As in most midterm elections, the party controlling the White House lost ground. Democrats took five governorships from the Republicans, while Republicans took 12 governorships from the Democrats. An independent won one governorship previously held by a Republican, while a Republican won one governorship previously held by an independent. Republicans held a majority of governorships for the first time since before the 2006 elections. One state, Louisiana, had no election for governor, but it did feature a special election for lieutenant governor.

<span class="mw-page-title-main">2009 United States gubernatorial elections</span>

United States gubernatorial elections were held on November 3, 2009, in the states of New Jersey and Virginia, as well as in the U.S. commonwealth of the Northern Mariana Islands on November 7, 2009. Both state governorships were previously held by Democrats elected in 2005, and both were won by Republicans in 2009; the local Covenant Party maintained control of the governorship of the Marianas. These elections formed part of the 2009 United States elections. As of 2024, this is the last election after which the Democratic party held a majority of governorships.

<span class="mw-page-title-main">1966 Florida gubernatorial election</span> Florida election result

The 1966 Florida gubernatorial election took place on November 8, 1966. During the primary election, the results from the Democratic Party were close among three of the four candidates. Thus, the top two Democrat candidates – incumbent Governor of Florida William "Haydon" Burns and Mayor of Miami Robert King High – competed in a runoff election on May 24, 1966. In an upset outcome, Robert King High was chosen over W. Haydon Burns as the Democratic Gubernatorial nominee. In contrast, the Republican primary was rather uneventful, with businessman Claude Roy Kirk Jr. easily securing the Republican nomination against Richard Muldrew. This was the first time a Republican was elected governor since Reconstruction.

<span class="mw-page-title-main">2008 Missouri lieutenant gubernatorial election</span> Election for Lieutenant Governor of Missouri

The 2008 Missouri lieutenant gubernatorial election was held on November 4, 2008, to elect the Lieutenant Governor of Missouri. Republican incumbent Peter Kinder won the election narrowly, despite the fact that Democrat Attorney General Jay Nixon won the 2008 Missouri gubernatorial election with over 57% of the vote.

<span class="mw-page-title-main">2020 United States gubernatorial elections</span>

United States gubernatorial elections were held on November 3, 2020, in 11 states and two territories. The previous gubernatorial elections for this group of states took place in 2016, except in New Hampshire and Vermont where governors only serve two-year terms. These two states elected their current governors in 2018. Nine state governors ran for reelection and all nine won, while Democrat Steve Bullock of Montana could not run again due to term limits and Republican Gary Herbert of Utah decided to retire at the end of his term.

<span class="mw-page-title-main">2022 United States gubernatorial elections</span> Election of 39 state governors

United States gubernatorial elections were held on November 8, 2022, in 36 states and three territories. As most governors serve four-year terms, the last regular gubernatorial elections for all but two of the seats took place in the 2018 U.S. gubernatorial elections. The gubernatorial elections took place concurrently with several other federal, state, and local elections, as part of the 2022 midterm elections.

References

  1. Sabato, Larry J.; Wasserman, David (6 November 2006). "Election Eve 2006: The Final Predictions". crystalball.centerforpolitics.org. Archived from the original on 2018-12-21.
  2. "The Rothenberg Political Report: 2006 Gubernatorial Ratings". rothenbergpoliticalreport.blogspot.com. 2 November 2006. Archived from the original on 2006-11-07.
  3. "2006 Governor Race Ratings" (PDF). cookpolitical.com. 6 November 2006. Archived from the original (PDF) on 2008-06-05.
  4. "Election 2006". Real Clear Politics. Retrieved June 25, 2021.
  5. "Election Returns, State of Alabama, General Election November 7, 2006" (PDF). Archived from the original (PDF) on 2011-07-23. Retrieved 2011-04-22.
  6. 1 2 "GEMS ELECTION RESULTS". elect.alaska.net.
  7. 1 2 "2006 - Alaska Governor Race | RealClearPolitics". www.realclearpolitics.com.
  8. "Voter Registration Statistics | Arizona Secretary of State" . Retrieved 7 May 2023.
  9. "SurveyUSA | America's Neighborhood Pollster".
  10. "State of Arizona Official Canvass, 2006 General Election - November 7, 2006" (PDF). Arizona Secretary of State. Archived from the original (PDF) on 2006-12-06. Retrieved 2014-01-06.
  11. "Rasmussen Reports: The most comprehensive public opinion coverage ever provided for a presidential election". Archived from the original on 2008-07-04. Retrieved 2006-10-29.
  12. "Results of SurveyUSA Election Poll #10443". www.surveyusa.com.
  13. "Voices of Arkansas: A Report on Voting Trends in the Natural State" (PDF). Arkansas Secretary of State. Archived from the original (PDF) on September 21, 2017. Retrieved June 27, 2014.
  14. "Governor" (PDF). Secretary of State of California. 2006-12-16. Archived from the original (PDF) on 2008-07-17. Retrieved 2008-07-16.
  15. "Rocky Mountain News: Elections". Archived from the original on 2006-09-20. Retrieved 2006-09-12.
  16. "Home | Zogby Liquor Store + Liquor Shop". Zogby.
  17. "Results of SurveyUSA Election Poll #10436". www.surveyusa.com.
  18. "Colorado Governor: Ritter by 12". rasmussenreports.com. 29 October 2006. Archived from the original on 2009-01-07. Retrieved 2006-10-29.
  19. "Approval Ratings for All 50 Governors". SurveyUSA. 2006-10-19. Retrieved 2006-11-05.
  20. "Vote for Governor and Lieutenant Governor 2006". STATE OF CONNECTICUT. Archived from the original on 6 Nov 2008. Retrieved 6 July 2021.
  21. "November 7, 2006 General Election". Florida Department of State. Retrieved 2022-05-15.
  22. "Democrat Almost Catches Crist In Florida Gov Race, Quinnipiac University Poll Finds; Big Shift By Independent Voters To Davis". poll.qu.edu. Quinnipiac University. 23 October 2006. Archived from the original on 2021-07-20. Retrieved 2021-07-20.
  23. "Florida Governor: Crist (R) 52%; Davis (D) 41%". www.rasmussenreports.com. Archived from the original on 2008-07-04. Retrieved 2006-10-31.
  24. "November 7, 2006 General Election, Governor and Lieutenant Governor". Florida Department of State Division of Elections. Retrieved June 30, 2016.
  25. "Georgia Election Results Official Results of the Tuesday, November 07, 2006 General Election". sos.georgia.gov. Archived from the original on 27 January 2008.
  26. "General Election 2006 - State of Hawaii - Statewide November 7, 2006 Summary Report" (PDF). State of Hawaii Office of Elections.
  27. "2006 General Results statewide". Archived from the original on 2008-02-06.
  28. "SurveyUSA - IL Gov". www.surveyusa.com.
  29. Wills, Christopher (1 July 2006). "Feds Probing Illinois Gov. Office Hiring". cbsnews.com. Archived from the original on 2007-12-24.
  30. "Election Polls 2006: Illinois Governor". Archived from the original on October 20, 2006. Retrieved October 20, 2006.
  31. "Results of SurveyUSA Election Poll #10435". www.surveyusa.com.
  32. "Ballots Cast". Elections.illinois.gov. 2006-11-07. Archived from the original on 2012-03-19. Retrieved 2015-03-30.
  33. "Survey of 500 Likely Voters". rasmussenreports.com. 9 October 2006. Archived from the original on 2006-10-21. Retrieved 2006-10-10.
  34. "Iowa Governor: Culver (D) 47%; Nussle (R) 44%". rasmussenreports.com. 27 October 2006. Archived from the original on 2008-09-06. Retrieved 2006-10-27.
  35. "Official Results Report - Statewide" (PDF). sos.state.ia.us. Archived from the original (PDF) on 2007-02-21.
  36. "Approval Ratings For All 50 Governors". SurveyUSA/KWCH-TV/KCTV-TV. 2006-07-20. Retrieved 2007-11-28.
  37. "2006 General Election Official Vote Totals" (PDF). Kansas Secretary of State.
  38. 1 2 "SurveyUSA | America's Neighborhood Pollster".
  39. "Election Polls 2006: Maine Governor". Archived from the original on 2006-10-20. Retrieved 2006-10-20.
  40. "Bureau of Corporations, Elections & Commissions, Elections Division". Archived from the original on 2007-01-27. Retrieved 2011-06-07.
  41. "2006 Gubernatorial General Election - County-Wide Turnout". elections.maryland.gov. Maryland State Board of Elections . Retrieved May 1, 2022.
  42. "Results of SurveyUSA Election Poll #10623". www.surveyusa.com.
  43. "Poll: Maryland". NBC News.
  44. "Official 2006 Gubernatorial General Election results for Governor / Lt. Governor". elections.maryland.gov.
  45. "Massachusetts gubernatorial election, 2006".
  46. "2006 Massachusetts Primary Election Results - Boston Globe - Boston.com". archive.boston.com.
  47. 2006 Massachusetts General Election Results: Governor/Lt. Governor Mass.gov
  48. "General Election Voter Registration/Turnout Statistics". Archived from the original on August 20, 2019. Retrieved October 6, 2019.
  49. "Results of SurveyUSA Election Poll #10641". www.surveyusa.com.
  50. "2006 Michigan Official General Election Results - 11/07/2006".
  51. "Results of SurveyUSA Election Poll #10437". www.surveyusa.com.
  52. "MN Election Results". electionresults.sos.state.mn.us. Retrieved April 6, 2018.
  53. "Governor and Lieutenant Governor". Archived from the original on 2008-05-07.
  54. "Rasmussen Reports: The most comprehensive public opinion coverage ever provided for a presidential election". Archived from the original on January 7, 2009. Retrieved January 7, 2009.
  55. "nvsos.gov". nvsos.gov. 2006-09-08. Retrieved 2013-04-02.
  56. "Summary Governor". Archived from the original on 2011-06-05. Retrieved 2011-05-26.
  57. "Canvass of Returns of General Election held on November 7, 2006 - State of New Mexico" (PDF). Archived from the original (PDF) on 2011-09-25. Retrieved 2022-04-27.
  58. "2010 November General Election Turnout Rates". electproject.org. 28 December 2011. Retrieved 12 February 2015.
  59. "Results" (PDF). www.elections.ny.gov. 2006. Retrieved 2021-04-06.
  60. Skolnick, David (10 April 2006). "Petro blasts Blackwell, his ideas". vindy.com. Archived from the original on 2019-07-02.
  61. "Election Poll 2006: Ohio Governor". Archived from the original on 2006-10-12. Retrieved 2006-10-15.
  62. "SurveyUSA Election Poll #10447". www.surveyusa.com.
  63. "GOVERNOR AND LIEUTENANT GOVERNOR: NOVEMBER 7, 2006". Ohio Secretary of State. Archived from the original on July 2, 2017. Retrieved April 27, 2022.
  64. 2006 election results for governor (accessed May 28, 2010).
  65. 2006 election results for governor (accessed May 28, 2010).
  66. "Rasmussen Reports: The most comprehensive public opinion coverage ever provided for a presidential election". Archived from the original on October 6, 2008. Retrieved November 3, 2006.
  67. "Content Manager WebDrawer - 2006 General Election Official Results".
  68. The Pennsylvania Manual, p. 7-84.
  69. "Election 2006 Poll". Archived from the original on 2006-05-18. Retrieved 2006-05-04.
  70. "Federal and Statewide Races Summary". Rhode Island Board of Elections. Archived from the original (PDF) on 20 November 2018. Retrieved 28 June 2018.
  71. "Do you approve or disapprove of the job Mark Sanford is doing as Governor?". SurveyUSA.
  72. "South Dakota Secretary of State - Election Information 2006". Archived from the original on 2006-11-23.
  73. "Tennessee Voter Turnout in 2006". Tennessee Secretary of State. November 7, 2006. Retrieved February 28, 2023.
  74. "November 7, 2006, General Election: Governor" (PDF). Tennessee Secretary of State. Archived from the original (PDF) on July 13, 2015. Retrieved June 27, 2014.
  75. "2006 General Election". Office of the Secretary of State (Texas). Archived from the original on 2014-01-09. Retrieved 2007-01-02.
  76. "Vermont Elections Division". vermont-elections.org. Archived from the original on 10 February 2014. Retrieved 14 January 2022.
  77. "Election Polls 2006: Wisconsin Governor". Archived from the original on March 11, 2007. Retrieved October 30, 2006.
  78. "WBAY-TV Green Bay-Fox Cities-Northeast Wisconsin News: WISC-TV poll shows Green closing on Doyle". Archived from the original on 2007-02-13. Retrieved 2006-11-03.
  79. "Wisconsin Blue Book 2007 – 2008 , County Vote for Governor, September 12, 2006 Primary" (PDF). Archived from the original (PDF) on May 30, 2010. Retrieved January 3, 2013.
  80. "Statewide Candidates Official Summary Wyoming General Election - November 7, 2006" (PDF). Wyoming Secretary of State.
  81. "Local Elections 2006, Washington, D.C. Full Ballot". The Washington Post . Archived from the original on 2012-10-25.