Elections to Adur District Council in West Sussex, England were held on 1 May 2008. Half of the council was up for election and the Conservative party held overall control of the council.
West Sussex is a county in the south of England, bordering East Sussex to the east, Hampshire to the west and Surrey to the north, and to the south the English Channel.
England is a country that is part of the United Kingdom. It shares land borders with Wales to the west and Scotland to the north-northwest. The Irish Sea lies west of England and the Celtic Sea lies to the southwest. England is separated from continental Europe by the North Sea to the east and the English Channel to the south. The country covers five-eighths of the island of Great Britain, which lies in the North Atlantic, and includes over 100 smaller islands, such as the Isles of Scilly and the Isle of Wight.
The Conservative Party, officially the Conservative and Unionist Party, is a centre-right political party in the United Kingdom. Presently led by Theresa May, it has been the governing party since 2010. It presently has 314 Members of Parliament in the House of Commons, 249 members of the House of Lords, and 18 members of the European Parliament. It also has 31 Members of the Scottish Parliament, 12 members of the Welsh Assembly, eight members of the London Assembly and 9,008 local councillors. One of the major parties of UK politics, it has formed the government on 45 occasions, more than any other party.
Four extra seats were up for election due to councillors stepping down. [1] No seats changed parties in the election with the Conservative party remaining the dominant party on the council.
After the election, the composition of the council was
Party | Seats | Gains | Losses | Net gain/loss | Seats % | Votes % | Votes | +/− | |
---|---|---|---|---|---|---|---|---|---|
Conservative | 16 | 0 | 0 | 0 | 88.9 | 50.5 | 10,064 | +1.2% | |
Shoreham Beach Residents Association | 2 | 0 | 0 | 0 | 11.1 | 8.4 | 1,674 | +2.5% | |
Liberal Democrat | 0 | 0 | 0 | 0 | 0 | 22.9 | 4,571 | -4.0% | |
Labour | 0 | 0 | 0 | 0 | 0 | 11.0 | 2,185 | +0.0% | |
Green | 0 | 0 | 0 | 0 | 0 | 4.2 | 839 | -2.7% | |
UKIP | 0 | 0 | 0 | 0 | 0 | 3.0 | 591 | +3.0% | |
Party | Candidate | Votes | % | ± | |
---|---|---|---|---|---|
Conservative | Debbie Kennard | 760 | 71.0 | ||
Liberal Democrat | Jan Kimber | 127 | 11.9 | ||
Labour | Julie Pearce | 93 | 8.7 | ||
Green | Vincent Tilsley | 91 | 8.5 | ||
Majority | 633 | 59.1 | |||
Turnout | 1,071 | 34 | |||
Conservative hold | Swing | ||||
Party | Candidate | Votes | % | ± | |
---|---|---|---|---|---|
Conservative | Pat Beresford | 506 | |||
Conservative | Ann Terry | 443 | |||
Liberal Democrat | Kim Bonnett | 430 | |||
Liberal Democrat | Stephen Martin | 408 | |||
Labour | Michael Thornton | 117 | |||
Turnout | 1,904 | 30 | |||
Conservative hold | Swing | ||||
Party | Candidate | Votes | % | ± | |
---|---|---|---|---|---|
Conservative | Norman Wright | 563 | 55.2 | +7.9 | |
Labour | Barry Mear | 257 | 25.2 | -4.2 | |
Liberal Democrat | Nilda Dooraree | 200 | 19.6 | -3.7 | |
Majority | 306 | 30.0 | +12.1 | ||
Turnout | 1,020 | 31 | |||
Conservative hold | Swing | ||||
Party | Candidate | Votes | % | ± | |
---|---|---|---|---|---|
Conservative | Emma Evans | 481 | 50.5 | ||
Labour | Sally Campbell | 193 | 20.3 | ||
Liberal Democrat | John Hilditch | 176 | 18.5 | ||
UKIP | Jenny Greig | 102 | 10.7 | ||
Majority | 288 | 30.2 | |||
Turnout | 952 | 29 | |||
Conservative hold | Swing | ||||
Party | Candidate | Votes | % | ± | |
---|---|---|---|---|---|
Conservative | Angus Dunn | 611 | 58.5 | -0.8 | |
Labour | Barry Thompson | 165 | 15.8 | -3.2 | |
UKIP | Rupert Greig | 149 | 14.3 | +14.3 | |
Liberal Democrat | Carolyn White | 119 | 11.4 | -10.3 | |
Majority | 446 | 42.7 | +5.1 | ||
Turnout | 1,044 | 31 | |||
Conservative hold | Swing | ||||
Party | Candidate | Votes | % | ± | |
---|---|---|---|---|---|
Conservative | Keith Dollemore | 725 | 68.5 | +8.9 | |
Liberal Democrat | Stuart Douch | 223 | 21.1 | -19.3 | |
Labour | Jean Turner | 111 | 10.5 | +10.5 | |
Majority | 502 | 47.4 | +28.2 | ||
Turnout | 1,059 | 33 | |||
Conservative hold | Swing | ||||
Party | Candidate | Votes | % | ± | |
---|---|---|---|---|---|
Shoreham Beach Residents Association | Liza McKinney | 852 | |||
Shoreham Beach Residents Association | Ben Stride | 822 | |||
Green | Stephen Barnes | 183 | |||
Labour | Agnes Daniel | 150 | |||
Liberal Democrat | Raj Dooraree | 76 | |||
Turnout | 2,083 | 34 | |||
Shoreham Beach Residents Association hold | Swing | ||||
Shorehma Beach Residents Association hold | Swing | ||||
Party | Candidate | Votes | % | ± | |
---|---|---|---|---|---|
Conservative | Brenda Collard | 485 | 52.9 | +9.0 | |
Liberal Democrat | Moira Collins | 259 | 28.3 | -16.2 | |
UKIP | Joyce Horne | 88 | 9.6 | +9.6 | |
Labour | John Wales | 84 | 9.2 | +9.2 | |
Majority | 226 | 24.6 | |||
Turnout | 916 | 28 | |||
Conservative hold | Swing | ||||
Party | Candidate | Votes | % | ± | |
---|---|---|---|---|---|
Conservative | Carson Albury | 597 | 59.6 | +3.3 | |
Liberal Democrat | Pauline Francis | 192 | 19.2 | -9.2 | |
Labour | Kenneth Bashford | 135 | 13.5 | -1.8 | |
UKIP | Ron Horne | 78 | 7.8 | +7.8 | |
Majority | 405 | 40.4 | +12.5 | ||
Turnout | 1,002 | 29 | |||
Conservative hold | Swing | ||||
Party | Candidate | Votes | % | ± | |
---|---|---|---|---|---|
Conservative | Rod Hotton | 514 | 49.7 | +2.5 | |
Green | Susan Board | 212 | 20.5 | +0.3 | |
Labour | Nigel Sweet | 136 | 13.2 | -2.7 | |
Liberal Democrat | Jane Cottrell | 99 | 9.6 | -7.1 | |
UKIP | Michael Henn | 73 | 7.1 | +7.1 | |
Majority | 302 | 29.2 | +2.2 | ||
Turnout | 1,034 | 32 | |||
Conservative hold | Swing | ||||
Party | Candidate | Votes | % | ± | |
---|---|---|---|---|---|
Conservative | Brian Coomber | 697 | 62.4 | +4.7 | |
Green | Martin Moyra | 160 | 14.3 | -3.3 | |
Liberal Democrat | Timothy Clarke | 135 | 12.1 | -2.0 | |
Labour | Simon Crisp | 125 | 11.2 | +0.7 | |
Majority | 537 | 48.1 | +8.0 | ||
Turnout | 1,117 | 35.4 | |||
Conservative hold | Swing | ||||
Party | Candidate | Votes | % | ± | |
---|---|---|---|---|---|
Conservative | Laura Graysmark | 522 | 56.5 | +7.0 | |
Labour | Ricky Daniel | 205 | 22.2 | -11.1 | |
Liberal Democrat | Tracey Clarke | 110 | 11.9 | -5.3 | |
Green | Celia Behan | 87 | 9.4 | +9.4 | |
Majority | 317 | 34.3 | +18.1 | ||
Turnout | 924 | 31 | |||
Conservative hold | Swing | ||||
Party | Candidate | Votes | % | ± | |
---|---|---|---|---|---|
Conservative | Peter Metcalfe | 668 | 56.0 | -7.0 | |
Liberal Democrat | David Edey | 169 | 14.2 | -9.2 | |
Labour | Steve Carden | 149 | 12.5 | -1.1 | |
Green | Alan Mair | 106 | 8.9 | +8.9 | |
UKIP | Brian Elliott | 101 | 8.5 | +8.5 | |
Majority | 499 | 41.8 | +2.2 | ||
Turnout | 1,193 | 34 | |||
Conservative hold | Swing | ||||
Party | Candidate | Votes | % | ± | |
---|---|---|---|---|---|
Conservative | Ann Bridges | 870 | |||
Conservative | Fred Lewis | 826 | |||
Conservative | Tony Nicklen | 796 | |||
Liberal Democrat | Doris Martin | 638 | |||
Liberal Democrat | Reginald Dolding | 617 | |||
Liberal Democrat | Cyril Cannings | 593 | |||
Labour | David Devoy | 265 | |||
Turnout | 4,605 | 37 | |||
Conservative hold | Swing | ||||
Half of Adur District Council in West Sussex, England is elected every two years. Until 2003, the council was elected by thirds. Since the last boundary changes in 2004, 29 councillors have been elected from 14 wards.
Elections to Adur District Council were held on 2 May 2002. One third of the council was up for election and the Conservative party gained control of the council from no overall control. Overall turnout was 33%.
Elections to Adur District Council were held on 1 May 2003. One third of the council was up for election and the Conservative party held overall control of the council. Overall turnout was 31.7%.
Elections to Adur District Council were held on 10 June 2004. The whole council was up for election with boundary changes since the last election in 2003 reducing the number of seats by 10. The Conservative party held overall control of the council. Overall turnout was 38.0%.
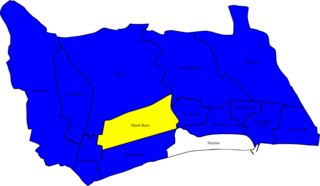
Elections to Adur District Council were held on 4 May 2006. Half of the council was up for election and the Conservative party held overall control of the council.
Elections to Daventry District Council in Northamptonshire, England were held on 1 May 2008. One third of the council was up for election and the Conservative party stayed in overall control of the council.
The 2008 West Lancashire District Council election took place on 1 May 2008 to elect members of West Lancashire District Council in Lancashire, England. One third of the council was up for election and the Conservative party stayed in overall control of the council.
Elections to West Lindsey District Council were held on 3 May 2007. One third of the council was up for election and the Liberal Democrat party held overall control of the council after what was seen as a straight fight with the Conservative party.
Elections to Rochford Council were held on 1 May 2008. One third of the council was up for election and the Conservative party stayed in overall control of the council.
The 2008 Worthing Borough Council election took place on 1 May 2008 to elect members of Worthing Borough Council in West Sussex, England. One third of the council was up for election and the Conservative party stayed in overall control of the council. Overall turnout was 35%.
The 2007 West Lancashire District Council election took place on 3 May 2007 to elect members of West Lancashire District Council in Lancashire, England. One third of the council was up for election and the Conservative party stayed in overall control of the council.
The 2010 Adur District Council election took place on 6 May 2010 to elect members of Adur District Council in West Sussex, England. Half of the council was up for election and the Conservative party stayed in overall control of the council.
The 2011 United Kingdom local elections were held on Thursday 5 May 2011. In England, direct elections were held in all 36 Metropolitan boroughs, 194 Second-tier district authorities, 49 unitary authorities and various mayoral posts, meaning local elections took place in all parts of England with the exception of seven unitary authorities, and seven districts and boroughs. For the majority of English districts and the 25 unitary authorities that are elected "all out" these were the first elections since 2007. In Northern Ireland, there were elections to all 26 local councils. Elections also took place to most English parish councils.
Local elections were held in the United Kingdom on 3 May 1979. The results provided some source of comfort to the Labour Party (UK), who recovered some lost ground from local election reversals in previous years, despite losing the general election to the Conservative Party on the same day.
Local elections were held in the United Kingdom in 1980. These were the first annual local elections for the new Conservative Prime Minister Margaret Thatcher. Though the Conservatives in government lost seats, the projected share of the vote was close: Labour Party 42%, Conservative Party 40%, Liberal Party 13%. Labour were still being led by the former prime minister James Callaghan, who resigned later in the year to be succeeded by Michael Foot.
The 2012 Adur District Council elections took place on 3 May 2012 to elect members of Adur District Council in West Sussex, England. Half of the council was up for election, and the Conservative Party remained in overall control of the council.
The 2016 Adur District Council elections took place on 5 May 2016 to elect members of Adur District Council in West Sussex, England. Half of the council was up for election, and the Conservative Party remained in overall control of the council. The Labour Party trebled their number of seats from one to three.
Elections to the Adur District Council were held on 3 May 1979, alongside the general election. The entire council was up for election, following boundary changes that reduced the number of wards by one, but altogether had added an additional two seats. Overall turnout was recorded at 74.4%.
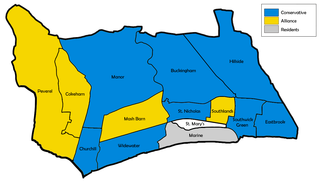
Elections to the Adur District Council were held on 6 May 1982, with one third of the council up for election. There was additional vacancies in the Mash Barn and Peverel wards, but no elections for the single-member ward St Marys and Residents stronghold, Marine, went uncontested. In the intervening years, the newly formed Alliance had gained three seats at the expense of the Conservatives. Overall turnout fell to 42.4%.
The 2018 Adur District Council elections took place on 3 May 2018 to elect members of Adur District Council in West Sussex, England. The election saw half of the Council's 29 seats up for election, and resulted in the Conservative Party retaining their majority on the council. Labour gained 4 seats to replace UKIP as the official opposition on the Council, who lost all the seats they were defending from 2014.