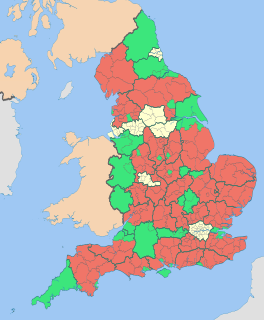
The 2012 Adur District Council elections took place on 3 May 2012 to elect members of Adur District Council in West Sussex, England. Half of the council was up for election, and the Conservative Party remained in overall control of the council. [1]
Non-metropolitan districts, or colloquially "shire districts", are a type of local government district in England. As created, they are sub-divisions of non-metropolitan counties in a two-tier arrangement.
West Sussex is a county in the south of England, bordering East Sussex to the east, Hampshire to the west and Surrey to the north, and to the south the English Channel.
England is a country that is part of the United Kingdom. It shares land borders with Wales to the west and Scotland to the north-northwest. The Irish Sea lies west of England and the Celtic Sea lies to the southwest. England is separated from continental Europe by the North Sea to the east and the English Channel to the south. The country covers five-eighths of the island of Great Britain, which lies in the North Atlantic, and includes over 100 smaller islands, such as the Isles of Scilly and the Isle of Wight.
After the election, the composition of the council was
The Conservative Party, officially the Conservative and Unionist Party, is a centre-right political party in the United Kingdom. Presently led by Theresa May, it has been the governing party since 2010. It presently has 314 Members of Parliament in the House of Commons, 249 members of the House of Lords, and 18 members of the European Parliament. It also has 31 Members of the Scottish Parliament, 12 members of the Welsh Assembly, eight members of the London Assembly and 9,008 local councillors. One of the major parties of UK politics, it has formed the government on 45 occasions, more than any other party.
The Labour Party is a centre-left political party in the United Kingdom which has been described as an alliance of social democrats, democratic socialists and trade unionists. The party's platform emphasises greater state intervention, social justice and strengthening workers' rights.
The Liberal Democrats are a liberal political party in the United Kingdom. They presently have 11 Members of Parliament in the House of Commons, 96 members of the House of Lords, and one member of the European Parliament. They also have five Members of the Scottish Parliament and a member each in the Welsh Assembly and London Assembly. The party reached the height of its influence in the early 2010s, forming a junior partner in a coalition government from 2010 to 2015. It is presently led by Vince Cable.
The election saw the Conservatives remain in overall control of the council after winning 13 of the 15 seats which were contested. They gained Eastbrook from the Liberal Democrats having lost it in a double vacancy at the 2010 elections, but this gain was offset by the loss of Cokeham to Labour, who thus gained their first representation on the council since 2006. In addition Labour saw their vote share rise by more than 12% across the district, whilst the UK Independence Party (UKIP) also saw their vote share increase. The Liberal Democrats were the main losers, seeing their vote fall by 14%, pushing their into fourth place, behind UKIP.
The UK Independence Party is a hard Eurosceptic, right-wing political party in the United Kingdom. It currently has one representative in the House of Lords and seven Members of the European Parliament (MEPs). It has four Assembly Members (AMs) in the National Assembly for Wales and one member in the London Assembly. The party reached its greatest level of success in the mid-2010s, when it gained two Members of Parliament and was the largest UK party in the European Parliament.
Party | Seats | Gains | Losses | Net gain/loss | Seats % | Votes % | Votes | +/− | |
---|---|---|---|---|---|---|---|---|---|
Conservative | 13 | 1 | 1 | 0 | 86.6 | 41.0 | 5,956 | -0.3 | |
Labour | 1 | 1 | 0 | +1 | 6.6 | 25.3 | 3,676 | +12.7 | |
UKIP | 0 | 0 | 0 | 0 | 0.0 | 17.5 | 2,535 | +6.3 | |
Liberal Democrat | 0 | 0 | 1 | -1 | 0.0 | 10.1 | 1,471 | -14.0 | |
Shoreham Beach Residents' Association | 1 | 0 | 0 | 0 | 6.6 | 4.1 | 594 | -0.7 | |
Green | 0 | 0 | 0 | 0 | 0.0 | 2.0 | 293 | -4.1 | |
Party | Candidate | Votes | % | ± | |
---|---|---|---|---|---|
Conservative | Debbie Kennard | 577 | 60.8 | +4.9 | |
Labour | Nicola Carden | 167 | 17.6 | N/A | |
UKIP | Mick Clark | 128 | 13.5 | +5.0 | |
Liberal Democrat | Julie Petrie | 77 | 8.1 | -27.5 | |
Majority | 410 | 43.2 | +22.9 | ||
Turnout | 949 | 30.1 | -43.9 | ||
Conservative hold | Swing | -6.4 | |||
Party | Candidate | Votes | % | ± | |
---|---|---|---|---|---|
Conservative | Pat Beresford | 326 | 36.1 | -6.5 | |
UKIP | David Bushell | 325 | 36.0 | +20.9 | |
Liberal Democrat | Steve Martin | 252 | 27.9 | -8.8 | |
Majority | 1 | 0.1 | -5.8 | ||
Turnout | 903 | 25.9 | -34.1 | ||
Conservative hold | Swing | -13.7 | |||
Party | Candidate | Votes | % | ± | |
---|---|---|---|---|---|
Labour | Barry Mear | 393 | 39.7 | +19.3 | |
Conservative | Nicholas Pigott | 351 | 35.4 | -6.8 | |
UKIP | David Bamber | 189 | 19.1 | +8.8 | |
Liberal Democrat | Nilda Dooraree | 58 | 5.9 | -21.2 | |
Majority | 42 | 4.3 | |||
Turnout | 991 | 29.1 | -34.9 | ||
Labour gain from Conservative | Swing | +13.1 | |||
Party | Candidate | Votes | % | ± | |
---|---|---|---|---|---|
Conservative | Dave Donaldson | 370 | 37.4 | ||
Labour | Alun Jones | 334 | 33.8 | ||
UKIP | Jenny Greig | 125 | 12.7 | ||
Green | Jennie Tindall | 88 | 8.9 | ||
Liberal Democrat | Tom Hilditch | 71 | 7.2 | ||
Majority | 36 | 3.6 | |||
Turnout | 988 | 29.0 | -34.0 | ||
Conservative gain from Liberal Democrat | Swing | ||||
Party | Candidate | Votes | % | ± | |
---|---|---|---|---|---|
Conservative | Angus Dunn | 499 | 51.0 | +3.2 | |
Labour | Julie Scarratt | 268 | 27.4 | N/A | |
UKIP | Rupert Greig | 150 | 15.3 | +3.4 | |
Liberal Democrat | Paul Taylor | 61 | 6.2 | -25.4 | |
Majority | 231 | 23.6 | +7.4 | ||
Turnout | 978 | 28.8 | -35.2 | ||
Conservative hold | Swing | -12.1 | |||
Party | Candidate | Votes | % | ± | |
---|---|---|---|---|---|
Conservative | Keith Dollemore | 391 | 40.9 | -8.0 | |
UKIP | Lionel Parsons | 326 | 34.1 | +16.9 | |
Labour | Michael Rubin | 147 | 15.4 | N/A | |
Liberal Democrat | Stuart Douch | 93 | 9.7 | -24.2 | |
Majority | 65 | 6.8 | -8.2 | ||
Turnout | 957 | 30.0 | -38.0 | ||
Conservative hold | Swing | -12.5 | |||
Party | Candidate | Votes | % | ± | |
---|---|---|---|---|---|
Shoreham Beach Residents' Association | Liza McKinney | 594 | 67.0 | +13.2 | |
UKIP | Peter Harvey | 122 | 13.8 | 0.0 | |
Labour | Joyce Burns | 109 | 12.3 | +0.9 | |
Liberal Democrat | Naira Baboumian | 62 | 7.0 | N/A | |
Majority | 472 | 53.2 | +20.3 | ||
Turnout | 887 | 25.0 | -45.0 | ||
Shoreham Beach Residents Associations hold | Swing | +6.6 | |||
Party | Candidate | Votes | % | ± | |
---|---|---|---|---|---|
Conservative | Andrew Barnes | 269 | 34.3 | -6.2 | |
UKIP | Sid Hilsum | 190 | 24.2 | +6.6 | |
Labour | Douglas Bradley | 174 | 22.2 | N/A | |
Liberal Democrat | Doris Martin | 151 | 19.3 | -22.6 | |
Majority | 79 | 10.1 | |||
Turnout | 784 | 23.8 | -35.2 | ||
Conservative hold | Swing | -6.4 | |||
Party | Candidate | Votes | % | ± | |
---|---|---|---|---|---|
Conservative | Carson Albury | 373 | 43.1 | -4.7 | |
Labour | Kenneth Bashford | 255 | 29.4 | +9.0 | |
UKIP | Reuben Whiting | 178 | 20.6 | +10.6 | |
Liberal Democrat | Raj Dooraree | 60 | 6.9 | -14.9 | |
Majority | 118 | 13.7 | -12.3 | ||
Turnout | 866 | 25.0 | -39.0 | ||
Conservative hold | Swing | -6.9 | |||
Party | Candidate | Votes | % | ± | |
---|---|---|---|---|---|
Conservative | Paul Graysmark | 329 | 38.0 | +0.3 | |
Labour | Richard Jones | 321 | 37.1 | +7.7 | |
UKIP | Frank Mills | 131 | 15.1 | +5.9 | |
Liberal Democrat | Cyril Cannings | 85 | 9.8 | -13.9 | |
Majority | 8 | 0.9 | -7.4 | ||
Turnout | 866 | 28.9 | -34.1 | ||
Conservative hold | Swing | -3.7 | |||
Party | Candidate | Votes | % | ± | |
---|---|---|---|---|---|
Conservative | Peter Metcalfe | 511 | 53.1 | +11.2 | |
Labour | Steve Carden | 238 | 24.7 | +9.3 | |
UKIP | Darryl Pledge | 123 | 12.8 | +7.4 | |
Liberal Democrat | David Edey | 91 | 9.4 | -12.7 | |
Majority | 273 | 28.4 | +8.6 | ||
Turnout | 963 | 27.1 | -39.9 | ||
Conservative hold | Swing | +1.0 | |||
Party | Candidate | Votes | % | ± | |
---|---|---|---|---|---|
Conservative | Rod Hotton | 335 | 35.6 | -6.0 | |
Labour | Irene Reed | 247 | 26.2 | -0.7 | |
Green | Lynn Finnigan | 205 | 21.8 | +2.3 | |
UKIP | Michael Henn | 103 | 10.9 | -1.1 | |
Liberal Democrat | John Hilditch | 51 | 5.4 | N/A | |
Majority | 88 | 9.4 | -5.3 | ||
Turnout | 941 | 27.5 | -35.5 | ||
Conservative hold | Swing | -4.4 | |||
Party | Candidate | Votes | % | ± | |
---|---|---|---|---|---|
Conservative | Brian Coomber | 572 | 50.0 | +2.5 | |
Labour | Sami Zeglam | 270 | 23.6 | +9.1 | |
Liberal Democrat | Janet Kimber | 153 | 13.4 | -9.0 | |
UKIP | Clive Burghard | 149 | 13.0 | +7.4 | |
Majority | 302 | 26.4 | +1.3 | ||
Turnout | 1,144 | 36.2 | -38.8 | ||
Conservative hold | Swing | -3.3 | |||
Party | Candidate | Votes | % | ± | |
---|---|---|---|---|---|
Conservative | Ann Bridges | 564 | |||
Conservative | Fred Lewis | 489 | |||
Labour | David Devoy | 390 | |||
Labour | Michael Thornton | 363 | |||
UKIP | George Osborne | 296 | |||
Liberal Democrat | Kay Vincent | 206 | |||
Turnout | 27.6 | -39.4 | |||
Conservative hold | Swing | ||||
Local government elections took place in England (only) on Thursday 4 May 2006. Polling stations were open between 7:00 and 22:00.
The 1998 Adur District Council election took place on 6 May 1999 to elect members of Adur District Council in West Sussex, England. One third of the council was up for election and the Liberal Democrat party lost overall control of the council to no overall control.
The 2008 Tandridge District Council election took place on 1 May 2008 to elect members of Tandridge District Council in Surrey, England. One third of the council was up for election and the Conservative party stayed in overall control of the council.
The 2006 Wokingham District Council election took place on 4 May 2006 to elect members of Wokingham Unitary Council in Berkshire, England. One third of the council was up for election and the Conservative party stayed in overall control of the council.
The 2010 Adur District Council election took place on 6 May 2010 to elect members of Adur District Council in West Sussex, England. Half of the council was up for election and the Conservative party stayed in overall control of the council.
Elections to Broxtowe Borough Council were held on 5 May 2011 to elect all 44 members to the Council.
The 2008 Stroud Council election took place on 1 May 2008 to elect members of Stroud District Council in Gloucestershire, England. One third of the council was up for election and the Conservative party stayed in overall control of the council.
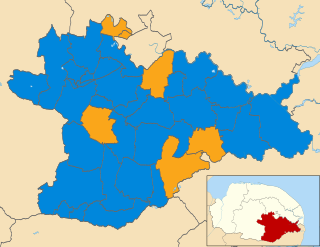
The elections to South Norfolk District Council were held on Thursday 5 May 2011 along with various other local elections around England, elections to the Scottish Parliament, National Assembly of Wales and Northern Ireland Assembly, and a referendum on whether to adopt the Alternative Vote electoral system for elections to the House of Commons. All 46 council seats were up for election. The previous council was controlled by the Conservatives, with the Liberal Democrats being the only opposition.
The 2013 United Kingdom local elections took place on Thursday 2 May 2013. Elections were held in 35 English councils: all 27 non-metropolitan county councils and eight unitary authorities, and in one Welsh unitary authority. Direct mayoral elections took place in Doncaster and North Tyneside. These elections last took place on the 4 June 2009 at the same time as the 2009 European Parliament Elections, except for County Durham, Northumberland and the Anglesey where elections last took place in 2008.
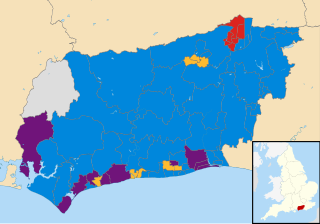
The West Sussex County Council election, 2013 took place on 2 May 2013, as part of the United Kingdom local elections, 2013. All 71 electoral divisions were up for election, which returned one county councillor each by first-past-the-post voting for a four-year term of office. At this election, the Conservative Party was seeking to retain overall control of the council, and the Liberal Democrats to maintain their position as the main opposition party.
An election to Hampshire County Council took place on 2 May 2013 as part of the United Kingdom local elections, 2013. 78 councillors were elected from 75 electoral divisions, which returned either one or two county councillors each by first-past-the-post voting for a four-year term of office. The electoral divisions were the same as those of the previous election in 2009. No elections were held in Portsmouth and Southampton, which are unitary authorities outside the area covered by the County Council. The election saw the Conservative Party retain overall control of the council, with a reduced majority of five councillors.
An election to Hertfordshire County Council took place on 2 May 2013 as part of the United Kingdom local elections, 2013. 77 electoral divisions elected one county councillor each by first-past-the-post voting for a four-year term of office. The electoral divisions were the same as those used at the previous election in 2009.
An election to Essex County Council took place on 2 May 2013 as part of the United Kingdom local elections, 2013. 75 councillors were elected from 70 electoral divisions, which returned either one or two county councillors each by first-past-the-post voting for a four-year term of office. The electoral divisions were the same as those used at the previous election in 2009. No elections were held in Thurrock or Southend-on-Sea, which are unitary authorities outside the area covered by the County Council.
The 2014 St Albans City and District Council election took place on 22 May 2014 to elect members of St Albans District Council in Hertfordshire, England. One third of the council was up for election and the council stayed under no overall control.
Elections to the Cannock Chase District Council took place on 22 May 2014, in line with other local elections in the United Kingdom which were held on the same day as the European Parliament elections. A total of 13 councillors were elected from 13 wards as a third of the council was up for election. There were no elections held in the Hagley or Hednesford South wards as those wards elect only two councillors in the other two years of the election cycle.
The 2014 Havant Borough Council election took place on 22 May 2014 to elect members of Havant Borough Council in Hampshire, England. One third of the council was up for election and the Conservative party stayed in overall control of the council.
The 2014 Huntingdonshire District Council election took place on 22 May 2014 to elect members of Huntingdonshire District Council in Cambridgeshire, England. One third of the council was up for election and the Conservative party stayed in overall control of the council.
The 2017 United Kingdom local elections were held on Thursday 4 May 2017. Local elections were held across Great Britain, with elections to 35 English local authorities and all councils in Scotland and Wales.
The 2017 Norfolk County Council election took place on 4 May 2017 as part of the 2017 local elections in the United Kingdom.
Elections to Cannock Chase District Council took place on 3 May 2018 on the same day as other local elections in England. A third of the council was up for election, meaning a total of 13 councillors were elected from all but two of the council's wards.