The 1999 Bromsgrove District Council election took place on 6 May 1999 to elect members of Bromsgrove district council in Worcestershire, England. The whole council was up for election and the Conservative party gained overall control of the council from the Labour party. [1]
Bromsgrove is a town in Worcestershire, England about 16 miles (26 km) north-east of Worcester and 13 miles (21 km) south-west of Birmingham city centre. It had a population of 29,237 in 2001. Bromsgrove is the main town in the larger Bromsgrove District. In the middle ages, it was a small market town producing cloth in the early modern period; in the eighteenth and nineteenth centuries it was a major centre of nail making.
Worcestershire is a county in the West Midlands of England. Between 1974 and 1998, it was merged with the neighbouring county of Herefordshire as Hereford and Worcester.
England is a country that is part of the United Kingdom. It shares land borders with Wales to the west and Scotland to the north-northwest. The Irish Sea lies west of England and the Celtic Sea lies to the southwest. England is separated from continental Europe by the North Sea to the east and the English Channel to the south. The country covers five-eighths of the island of Great Britain, which lies in the North Atlantic, and includes over 100 smaller islands, such as the Isles of Scilly and the Isle of Wight.
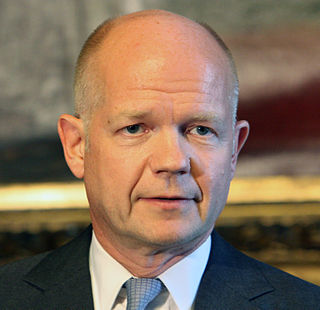
The Labour party had won control of the council in the previous election in 1995 for the first time and were hopeful of staying in control of the council. [2] They pledged to maintain bus passes for the elderly and press on with CCTV in the town centre. [2] However the Conservatives attacked Labour for having increased council tax over the last four years, including 9.73% in the last year. [3] A proposed development on the local recreation ground for an arts and leisure centre was a major issue in the campaign, with Labour saying it would be good for Bromsgrove, while the Conservatives pledged to try to save the recreation ground. [3] During the campaign the Conservative party leader William Hague visited Bromsgrove with the local Member of Parliament Julie Kirkbride to rally party activists. [2]
William Jefferson Hague, Baron Hague of Richmond, is a British Conservative politician and life peer. He represented Richmond, Yorkshire, as its Member of Parliament (MP) from 1989 to 2015 and was the Leader of the Opposition from 1997 to 2001. He was Secretary of State for Foreign and Commonwealth Affairs from 2010 to 2014 and was the Leader of the House of Commons from 2014 to 2015.
Julie Kirkbride is a British Conservative politician. She was the Member of Parliament for the Conservative stronghold of Bromsgrove from the 1997 to the 2010 general elections.
Before the election the Conservatives required a 7% swing to gain control of the council, with Bromsgrove seen as a key council in the local elections across England. [4] [5] A by-election in October 1998 in Catshill ward was seen as a good sign for the Conservatives after they gained the seat with a swing of over 25%. [6] In total 80 candidates stood in the election from the Labour party, Conservatives, Liberal Democrats and the Wythall Ratepayers' and Residents' Association. [7] Candidates included seven couples and former Conservative councillors such as Joy Buchby and Nick Psirides. Meanwhile, the only Liberal Democrat councillor, Sandra Docker, stood down at the election. [7]
Catshill is a village in Worcestershire about 2.5 miles north of Bromsgrove and 10 miles south-west of Birmingham. The parish of Catshill was formed around the Turnpike Road (A38) in 1844.
The Liberal Democrats are a liberal political party in the United Kingdom. They presently have 11 Members of Parliament in the House of Commons, 96 members of the House of Lords, and one member of the European Parliament. They also have five Members of the Scottish Parliament and a member each in the Welsh Assembly and London Assembly. The party reached the height of its influence in the early 2010s, forming a junior partner in a coalition government from 2010 to 2015. It is presently led by Vince Cable.
Just before the election there was controversy over Labour party leaflets that were sent to pensioners claiming that the Conservatives would abolish free bus passes for pensioners. [8] The Conservatives denied they would end the bus passes and reported Labour to the Data Protection Registrar, claiming that confidential council records had been used to send the leaflets to target pensioners, although Labour denied this. [8]
The results in Bromsgrove were one of the first to come in across the country and saw the Conservatives retake control of the council gaining 17 seats. [9] Conservative gains included the Labour leader on the council, Trevor Porter in Sidemoor ward, [10] and the council chairman, Trevor Crashley in Whitford ward. [11] The Conservatives also made two wins in a ward where they had never won any seats before, with swings reaching up to 40% in some wards. [10]
Sidemoor is a village within the urban area of Bromsgrove, Worcestershire.
Defeated candidates saw a low turnout and the plans to develop the recreation ground as responsible for their defeats, [11] with the neighbouring Labour MP Michael John Foster blaming the results on local, rather than national, issues. [12] Following the election William Hague visited Bromsgrove again to celebrate the results, both in Bromsgrove and nationally. [13] Overall turnout in the election was 37.4%. [14]
Voter turnout is the percentage of eligible voters who cast a ballot in an election. Eligibility varies by country, and the voting-eligible population should not be confused with the total adult population. Age and citizenship status are often among the criteria used to determine eligibility, but some countries further restrict eligibility based on sex, race, or religion.
Party | Seats | Gains | Losses | Net gain/loss | Seats % | Votes % | Votes | +/− | |
---|---|---|---|---|---|---|---|---|---|
Conservative | 30 | +17 | 76.9 | 56.6 | 29,876 | ||||
Labour | 7 | -16 | 17.9 | 35.3 | 18,637 | ||||
Wythall Ratepayers' and Residents' Association | 2 | 0 | 5.1 | 4.5 | 2,382 | ||||
Liberal Democrat | 0 | -1 | 0 | 3.6 | 1,912 |
Party | Candidate | Votes | % | ± | |
---|---|---|---|---|---|
Conservative | J Luck | 1,108 | |||
Conservative | J Griffiths | 1,044 | |||
Conservative | B Taylor | 1,002 | |||
Labour | D Waters | 723 | |||
Labour | S Oliver | 677 | |||
Labour | A Clewlow | 604 | |||
Turnout | 5,158 | 37.3 |
Party | Candidate | Votes | % | ± | |
---|---|---|---|---|---|
Conservative | A Doyle | 1,309 | |||
Conservative | M Taylor | 1,253 | |||
Liberal Democrat | T Gray | 458 | |||
Labour | J Cochrane | 412 | |||
Turnout | 3,432 | 43.1 |
Party | Candidate | Votes | % | ± | |
---|---|---|---|---|---|
Labour | D McGrath | 598 | |||
Labour | P Williamson | 509 | |||
Conservative | G Bennett | 432 | |||
Liberal Democrat | G Ray | 298 | |||
Turnout | 1,837 | 34.5 |
Party | Candidate | Votes | % | ± | |
---|---|---|---|---|---|
Conservative | P Collins | 1,095 | |||
Conservative | S Bushby | 999 | |||
Conservative | D Gardner | 941 | |||
Labour | S Farr | 551 | |||
Labour | G Witcomb | 543 | |||
Labour | A Deakin | 534 | |||
Turnout | 4,663 | 35.0 |
Party | Candidate | Votes | % | ± | |
---|---|---|---|---|---|
Labour | L McNamara | 829 | |||
Labour | C Brooks | 798 | |||
Conservative | B Graham | 494 | |||
Conservative | J Pardoe | 440 | |||
Turnout | 2,561 | 30.7 |
Party | Candidate | Votes | % | ± | |
---|---|---|---|---|---|
Conservative | R Deeming | 370 | 72.0 | ||
Labour | J Peel | 144 | 28.0 | ||
Majority | 226 | 44.0 | |||
Turnout | 514 | 35.5 |
Party | Candidate | Votes | % | ± | |
---|---|---|---|---|---|
Conservative | J Dyer | 811 | |||
Wythall Ratepayers' and Residents' Association | G Denaro | 662 | |||
Wythall Ratepayers' and Residents' Association | J Gardener | 659 | |||
Wythall Ratepayers' and Residents' Association | L Wright | 620 | |||
Conservative | D Woodward-Sheath | 592 | |||
Labour | C Brooks | 286 | |||
Turnout | 3,630 | 24.8 |
Party | Candidate | Votes | % | ± | |
---|---|---|---|---|---|
Conservative | P Barnsley | 932 | |||
Conservative | T Matthews | 834 | |||
Labour | M Harford | 318 | |||
Turnout | 2,084 | 36.9 |
Party | Candidate | Votes | % | ± | |
---|---|---|---|---|---|
Conservative | M Oliver | 914 | |||
Conservative | H Whitehouse | 869 | |||
Labour | A Zalin | 274 | |||
Turnout | 2,057 | 34.9 |
Party | Candidate | Votes | % | ± | |
---|---|---|---|---|---|
Conservative | P Duddy | 383 | 63.3 | ||
Wythall Ratepayers' and Residents' Association | P Harrison | 149 | 24.6 | ||
Labour | E Holmes | 73 | 12.1 | ||
Majority | 234 | 38.7 | |||
Turnout | 605 | 36.6 |
Party | Candidate | Votes | % | ± | |
---|---|---|---|---|---|
Conservative | D North | 1,542 | |||
Conservative | C Lanham | 1,466 | |||
Conservative | N Psirides | 1,418 | |||
Labour | P Baker | 892 | |||
Labour | R Clayton | 876 | |||
Labour | W Newnes | 831 | |||
Turnout | 7,025 | 43.9 |
Party | Candidate | Votes | % | ± | |
---|---|---|---|---|---|
Conservative | R Dent | 844 | |||
Labour | C Mole | 736 | |||
Conservative | J Hancox | 733 | |||
Conservative | B Gall | 707 | |||
Labour | T Porter | 624 | |||
Labour | G Hulett | 620 | |||
Liberal Democrat | M Parr | 341 | |||
Turnout | 4,605 | 37.6 |
Party | Candidate | Votes | % | ± | |
---|---|---|---|---|---|
Conservative | S Peters | 318 | 47.3 | ||
Wythall Ratepayers' and Residents' Association | H Allen | 292 | 43.5 | ||
Labour | P O'Connor | 62 | 9.2 | ||
Majority | 26 | 3.8 | |||
Turnout | 672 | 36.7 |
Party | Candidate | Votes | % | ± | |
---|---|---|---|---|---|
Conservative | C Tidmarsh | 613 | 66.6 | ||
Labour | A Wardle | 308 | 33.4 | ||
Majority | 305 | 33.2 | |||
Turnout | 921 | 41.5 |
Party | Candidate | Votes | % | ± | |
---|---|---|---|---|---|
Conservative | A Hadley | 1,130 | |||
Conservative | E Shaw | 1,123 | |||
Labour | C Rudge | 753 | |||
Labour | S Shannon | 739 | |||
Liberal Democrat | G Selway | 155 | |||
Turnout | 3,900 | 46.9 |
Party | Candidate | Votes | % | ± | |
---|---|---|---|---|---|
Conservative | P Whittaker | 502 | 78.4 | ||
Labour | R Cooke | 138 | 21.6 | ||
Majority | 364 | 56.8 | |||
Turnout | 640 | 46.0 |
Party | Candidate | Votes | % | ± | |
---|---|---|---|---|---|
Labour | P McDonald | 788 | |||
Conservative | D Hancox | 741 | |||
Labour | C Wilson | 636 | |||
Labour | K McNamara | 601 | |||
Liberal Democrat | G Mack | 438 | |||
Turnout | 3,204 | 39.3 |
Party | Candidate | Votes | % | ± | |
---|---|---|---|---|---|
Conservative | E Tibby | 814 | |||
Conservative | K Gall | 776 | |||
Conservative | G Pardoe | 762 | |||
Labour | T Crashley | 704 | |||
Labour | M Holmes | 672 | |||
Labour | J Marshall | 631 | |||
Liberal Democrat | M Mihailovic | 222 | |||
Turnout | 4,581 | 36.9 |
Party | Candidate | Votes | % | ± | |
---|---|---|---|---|---|
Conservative | M Gill | 565 | 78.7 | ||
Labour | B Sutherland | 153 | 21.3 | ||
Majority | 412 | 57.4 | |||
Turnout | 718 | 41.2 |
Bromsgrove District Council in Worcestershire, England is elected every four years. The elections take place on the first Thursday of May and elect 39 councillors from 23 wards. By-elections are held for any seats which become vacant between the four yearly elections.
The 2002 West Lancashire District Council election took place on 2 May 2002 to elect members of West Lancashire District Council in Lancashire, England. The whole council was up for election with boundary changes since the last election in 2000 reducing the number of seats by 1. The Conservative party gained overall control of the council from Labour.
The 1998 Wolverhampton Metropolitan Borough Council election took place on 7 May 1998 to elect members of Wolverhampton Metropolitan Borough Council in the West Midlands, England. One third of the council was up for election and the Labour party kept overall control of the council.
Local elections were held in the United Kingdom on 6 May 1976. Elections were for one third of the seats on Metropolitan borough councils and for all seats on Non-Metropolitan district councils in England; and for all seats on the Welsh district councils.
The 1999 Ashford Borough Council election took place on 6 May 1999 to elect members of Ashford Borough Council in Kent, England. The whole council was up for election and the council stayed under no overall control.
The 1999 Redditch Borough Council election took place on 6 May 1999 to elect members of Redditch Borough Council in the West Midlands region, England. One third of the council was up for election and the Labour party stayed in overall control of the council.
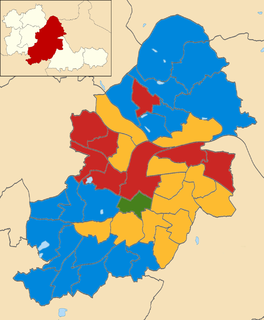
Elections to Birmingham City Council in England were held on 1 May 2008. One third of the council was up for election and the council stayed under no overall control as it had been since 2003.
The 1999 Lichfield District Council election took place on 6 May 1999 to elect members of Lichfield District Council in Staffordshire, England. The whole council was up for election and the Conservative party gained overall control of the council from the Labour party.
The 1998 Wandsworth Council election took place on 7 May 1998 to elect members of Wandsworth London Borough Council in London, England. The whole council was up for election and the Conservative party stayed in overall control of the council.
The 1999 Wyre Forest District Council election took place on 6 May 1999 to elect members of Wyre Forest District Council in Worcestershire, England. One third of the council was up for election and the Labour party lost overall control of the council to no overall control.
The 2003 Worcester City Council election took place on 1 May 2003 to elect members of Worcester District Council in Worcestershire, England. One third of the council was up for election and the Conservative party gained overall control of the council from no overall control.
The 1999 Southend-on-Sea Council election took place on 6 May 1999 to elect members of Southend-on-Sea Unitary Council in Essex, England. One third of the council was up for election and the council stayed under no overall control.
The 2000 Southend-on-Sea Council election took place on 4 May 2000 to elect members of Southend-on-Sea Unitary Council in Essex, England. One third of the council was up for election and the Conservative party gained overall control of the council from no overall control.
The 1999 Solihull Metropolitan Borough Council election took place on 6 May 1999 to elect members of Solihull Metropolitan Borough Council in the West Midlands, England. One third of the council was up for election and the council stayed under no overall control.
The 2000 Solihull Metropolitan Borough Council election took place on 4 May 2000 to elect members of Solihull Metropolitan Borough Council in the West Midlands, England. One third of the council was up for election and the Conservative party gained overall control of the council from no overall control.
The 2003 Solihull Metropolitan Borough Council election took place on 1 May 2003 to elect members of Solihull Metropolitan Borough Council in the West Midlands, England. One third of the council was up for election and the Conservative party stayed in overall control of the council.
The 2006 Solihull Metropolitan Borough Council election took place on 4 May 2006 to elect members of Solihull Metropolitan Borough Council in the West Midlands, England. One third of the council was up for election and the Conservative party stayed in overall control of the council.
The 1999 Sunderland Council election took place on 6 May 1999 to elect members of Sunderland Metropolitan Borough Council in Tyne and Wear, England. One third of the council was up for election and the Labour party stayed in overall control of the council.
The 1999 Sandwell Metropolitan Borough Council election took place on 6 May 1999 to elect members of Sandwell Metropolitan Borough Council in the West Midlands, England. One third of the council was up for election and the Labour party stayed in overall control of the council.
The 1999 Castle Point Borough Council election took place on 6 May 1999 to elect members of Castle Point Borough Council in Essex, England. The whole council was up for election and the Labour party stayed in overall control of the council.