Conventional warfare is a form of warfare conducted by using conventional weapons and battlefield tactics between two or more states in open confrontation. The forces on each side are well-defined and fight by using weapons that target primarily the opponent's military. It is normally fought by using conventional weapons, not chemical, biological, radiological, or nuclear weapons.

The Hellenic Armed Forces are the combined ground, naval and air forces of Greece. They consist of the Hellenic Army, the Hellenic Navy, and the Hellenic Air Force.

Gross domestic product (GDP) is a monetary measure of the market value of all the final goods and services produced in a specific time period by countries. GDP (nominal) per capita does not, however, reflect differences in the cost of living and the inflation rates of the countries; therefore, using a basis of GDP per capita at purchasing power parity (PPP) may be more useful when comparing living standards between nations, while nominal GDP is more useful comparing national economies on the international market. Total GDP can also be broken down into the contribution of each industry or sector of the economy. The ratio of GDP to the total population of the region is the per capita GDP and the same is called Mean Standard of Living.
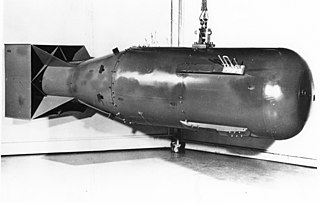
Nuclear warfare also known as, atomic warfare and thermonuclear warfare, is a military conflict or political strategy that deploys nuclear weaponry. Nuclear weapons are weapons of mass destruction; in contrast to conventional warfare, nuclear warfare can produce destruction in a much shorter time and can have a long-lasting radiological result. A major nuclear exchange would have long-term effects, primarily from the fallout released, and could also lead to a "nuclear winter" that could last for decades, centuries, or even millennia after the initial attack. Some analysts dismiss the nuclear winter hypothesis, and calculate that even with nuclear weapon stockpiles at Cold War highs, although there would be billions of casualties, billions more people living in rural areas would nevertheless survive. However, others have argued that secondary effects of a nuclear holocaust, such as nuclear famine and societal collapse, would cause almost every human on Earth to starve to death.

World War III or the Third World War, often abbreviated as WWIII or WW3, are names given to a hypothetical third worldwide large-scale military conflict subsequent to World War I and World War II. The term has been in use since at least as early as 1941. Some apply it loosely to limited or more minor conflicts such as the Cold War or the war on terror. In contrast, others assume that such a conflict would surpass prior world wars in both scope and destructive impact.

A developed country is a sovereign state that has a high quality of life, developed economy and advanced technological infrastructure relative to other less industrialized nations. Most commonly, the criteria for evaluating the degree of economic development are gross domestic product (GDP), gross national product (GNP), the per capita income, level of industrialization, amount of widespread infrastructure and general standard of living. Which criteria are to be used and which countries can be classified as being developed are subjects of debate. A point of reference of US$20,000 in 2021 USD nominal GDP per capita for the International Monetary Fund (IMF) is a good point of departure, it is a similar level of development to the United States in 1960.
College and university rankings are rankings of institutions in higher education based on combinations of various factors. None of the rankings give a comprehensive overview of the strengths of the institutions because all select a range of quantifiable characteristics to base their results on. Rankings have been conducted by magazines, newspapers, websites, governments, and academics. In addition to ranking entire institutions, organizations rank programs, departments, and schools. Rankings consider various combinations of measures of funding and endowment, research excellence and/or influence, specialization expertise, admissions, student options, award numbers, internationalization, graduate employment, industrial linkage, historical reputation and other criteria. Various rankings mostly evaluating on institutional output by research. Some rankings evaluate institutions within a single country, while others assess institutions worldwide. The subject has produced much debate about rankings' usefulness and accuracy. The expanding diversity in rating methodologies and accompanying criticisms of each indicate the lack of consensus in the field. Further, it seems possible to game the ranking systems through excessive self-citations or by researchers supporting each other in surveys. UNESCO has questioned whether rankings "do more harm than good", while acknowledging that "Rightly or wrongly, they are perceived as a measure of quality and so create intense competition between universities all over the world".
National power is defined as the sum of all resources available to a nation in the pursuit of national objectives. Assessing the national power of political entities was already a matter of relevance during the classical antiquity, the middle ages and the renaissance and today.
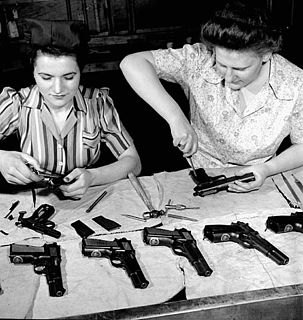
The arms industry, also known as the arms trade, is a global industry which manufactures and sells weapons and military technology. It consists of a commercial industry involved in the research and development, engineering, production, and servicing of military material, equipment, and facilities. Arms-producing companies, also referred to as arms dealers, or as the military industry, produce arms for the armed forces of states and for civilians. Departments of government also operate in the arms industry, buying and selling weapons, munitions and other military items. An arsenal is a place where arms and ammunition - whether privately or publicly owned - are made, maintained and repaired, stored, or issued, in any combination. Products of the arms industry include guns, artillery, ammunition, missiles, military aircraft, military vehicles, ships, electronic systems, night-vision devices, holographic weapon sights, laser rangefinders, laser sights, hand grenades, landmines and more. The arms industry also provides other logistical and operational support.
Comprehensive National Power (CNP) is a measure of the general power of a nation-state. It is a putative measure, important in the contemporary political thought of the People's Republic of China from the 1980s onwards and first introduced into official documents in 1992.

The ease of doing business index was an index created jointly by Simeon Djankov, Michael Klein, and Caralee McLiesh, three leading economists at the World Bank Group. The academic research for the report was done jointly with professors Edward Glaeser, Oliver Hart, and Andrei Shleifer. Higher rankings indicated better, usually simpler, regulations for businesses and stronger protections of property rights. Empirical research funded by the World Bank to justify their work show that the economic growth impact of improving these regulations is strong. Though the first report was authored by Djankov, Klein, and McLiesh, and they continue to be listed as "founders" of the report, some sources attribute the genesis of the idea to Djankov and Gerhard Pohl. The report was discontinued by the World Bank on September 16, 2021, following the release of an independent audit of the data irregularities. The audit documented how bank leadership pressured experts to manipulate the results of the 2018 and 2020 Doing Business Reports.

Global Peace Index (GPI) is a report produced by the Institute for Economics & Peace (IEP) which measures the relative position of nations' and regions' peacefulness. The GPI ranks 172 independent states and territories according to their levels of peacefulness. In the past decade, the GPI has presented trends of increased global violence and less peacefulness.
The Economist Intelligence Unit’s where-to-be-born index attempts to measure which country will provide the best opportunities for a healthy, safe and prosperous life in the years ahead. It is based on a method that links the results of subjective life-satisfaction surveys to the objective determinants of quality of life across countries along with a forward-looking element.

A potential superpower is a state or a political and economic entity that is speculated to be—or to have the potential to soon become—a superpower.

India is world's 3rd largest consumer of electricity and world's 3rd largest renewable energy producer with 38% of energy capacity installed in the year 2020 coming from renewable sources. Ernst & Young's (EY) 2021 Renewable Energy Country Attractiveness Index (RECAI) ranked India 3rd behind USA and China. In November 2021, India had a renewable energy capacity of 150 GW consisting of solar, wind, small hydro power, bio-mass, large hydro, and nuclear. India has committed for a goal of 450 GW renewable energy capacity by 2030.
Different methods of electricity generation can incur a variety of different costs, which can be divided into three general categories: 1) wholesale costs, or all costs paid by utilities associated with acquiring and distributing electricity to consumers, 2) retail costs paid by consumers, and 3) external costs, or externalities, imposed on society.

Multidimensional Poverty Indices use a range of indicators to calculate a summary poverty figure for a given population, in which a larger figure indicates a higher level of poverty. This figure considers both the proportion of the population that is deemed poor, and the 'breadth' of poverty experienced by these 'poor' households, following the Alkire & Foster 'counting method'. The method was developed following increased criticism of monetary and consumption based poverty measures, seeking to capture the deprivations in non-monetary factors that contribute towards well-being. While there is a standard set of indicators, dimensions, cutoffs & thresholds used for a 'Global MPI', the method is flexible and there are many examples of poverty studies that modify it to best suit their environment. The methodology has been mainly, but not exclusively, applied to developing countries.

The Logistics Performance Index (LPI) is an interactive benchmarking tool created by the World Bank to help countries identify the challenges and opportunities they face in their performance on trade logistics and what they can do to improve their performance. It is the weighted average of the country scores on six key dimensions: customs performance, infrastructure quality, ease of arranging shipments, logistics services quality, consignments tracking and tracing and timeliness of shipments. This measure indicates the relative ease and efficiency with which products can be moved into and inside a country. Germany and Sweden are the most efficient and highest ranked LPI countries as per the 2018 LPI.

The Global Terrorism Index (GTI) is a report published annually by the Institute for Economics and Peace (IEP), and was developed by IT entrepreneur and IEP's founder Steve Killelea. The index provides a comprehensive summary of the key global trends and patterns in terrorism since 2000. It is an attempt to systematically rank the nations of the world according to terrorist activity. The index combines a number of factors associated with terrorist attacks to build an explicit picture of the impact of terrorism, illustrating trends, and providing a data series for analysis by researchers and policymakers. It produces a composite score in order to provide an ordinal ranking of countries on the impact of terrorism.

The Threat Matrix is an intelligence-based measure and thorough assessments database program that Pakistani government officials and military science circles use in evaluating perceived external and internal threats that challenge the national security of Pakistan. Development began in 2011 under the government of Prime minister Yousaf Raza Gillani. The program identifies the military's operational priorities and goes beyond in comprehensively describing both existential and non-existential threats to the country. The Threat Matrix program is viewed to become a permanent fixture of the national security policy of Pakistan.