Jozini Local Municipality

Last updated
Jozini
Jozini CoA.png
Map of KwaZulu-Natal with Jozini highlighted.svg
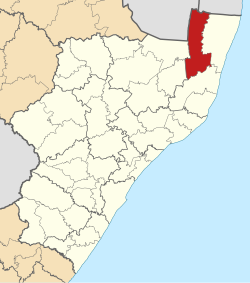
Location in KwaZulu-Natal
Country South Africa
Province KwaZulu-Natal
District uMkhanyakude
Seat Jozini
Wards 23
Government
[1]
  Type Municipal council
  MayorMfananaye Mathe (IFP)
Area
  Total
3,442 km2 (1,329 sq mi)
Population
 (2011) [2]
  Total
186,502
  Density54.18/km2 (140.3/sq mi)
Racial makeup (2011)
   Black African 99.2%
   Coloured 0.1%
   Indian/Asian 0.2%
   White 0.3%
First languages (2011)
[2]
   Zulu 95.1%
   English 1.2%
   Southern Ndebele 1.1%
  Other2.6%
Time zone UTC+2 (SAST)
Municipal codeKZN272

Jozini Municipality (Zulu : UMasipala wase Jozini) is a local municipality within the Umkhanyakude District Municipality, in the KwaZulu-Natal province of South Africa. Significant portions of the municipality have been neglected in terms of economic development. There is a great disparity between the level of service and infrastructure provision between settlement nodes, such as the towns of Mkuze and Jozini, and the surrounding rural areas. Most of the rural area is associated with a lack of development, poverty and poor service provision. [3]

Contents

Main places

The 2001 census divided the municipality into the following main places: [4]

PlaceCodeArea (km2)Population
Ingwavuma 53301 1.721,089
Jozini 53312 0.45543
Manukuza/Jobe 53303 280.6518,277
Mathenjwa 53304 435.1326,332
Mkuze 53305 1.041,834
Mngomezulu 53306 277.8218,676
Myeni/Ngwenya 53307 138.3410,146
Myeni/Ntsinde 53308 172.9116,524
Ndumu Game Reserve 53309 110.4372
Nyawo 53310 909.8568,148
Sqakatha 53311 238.2219,818
Remainder of the municipality 53302 523.022,628

Politics

The municipal council consists of 45 members elected by mixed-member proportional representation. Twenty-three councillors are elected by first-past-the-post voting in twenty-three wards, while the remaining twenty-two are chosen from party lists so that the total number of party representatives is proportional to the number of votes received.

In the election of 1 November 2021 the Inkatha Freedom Party (IFP) won 24 out of the 45 seats.

The following table shows the results of the 2021 election. [5]

PartyWardListTotal
seats
Votes%SeatsVotes%Seats
Inkatha Freedom Party 31,07350.561932,55653.64524
African National Congress 20,73933.74222,25336.661416
Economic Freedom Fighters 2,6174.2602,8844.7522
Independent candidates 5,4858.9222
Academic Congress Union 9811.6211
Democratic Alliance 3400.5503480.5700
National Freedom Party 2900.4703560.5900
United Christian Democratic Party 2640.4302440.4000
Independent Alliance 560.0904210.6900
African Transformation Movement 1900.3102240.3700
Abantu Batho Congress 1230.2001380.2300
United Democratic Movement 1030.1701050.1700
African Christian Democratic Party 640.100940.1500
National People's Front 780.130480.0800
Black First Land First 310.050210.0300
Democratic Union Plus 90.010200.0300
Total61,462100.002360,693100.002245
Valid votes61,46298.7460,69397.83
Invalid/blank votes7841.261,3442.17
Total votes62,246100.0062,037100.00
Registered voters/turnout103,71260.02103,71259.82

References

  1. "Contact list: Executive Mayors". Government Communication & Information System. Archived from the original on 14 July 2010. Retrieved 22 February 2012.
  2. 1 2 "Statistics by place". Statistics South Africa. Retrieved 27 September 2015.
  3. "KwaZulu-Natal Top Business | Jozini Municipality". www.kzntopbusiness.co.za.
  4. "Lookup Tables - Statistics South Africa".
  5. "Election Result Table for LGE2021 — Jozini". wikitable.frith.dev. Retrieved 2021-11-28.

27°25′45″S32°04′00″E / 27.42917°S 32.06667°E / -27.42917; 32.06667