Zululand District Municipality

Last updated

Zululand
Zululand CoA.png
Map of KwaZulu-Natal with Zululand highlighted (2016).svg
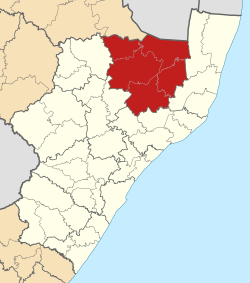
Location in KwaZulu-Natal
Coordinates: 28°19′S31°25′E / 28.317°S 31.417°E / -28.317; 31.417
Country South Africa
Province KwaZulu-Natal
Seat Ulundi
Local municipalities
Government
[1]
  Type Municipal council
  MayorThulasizwe Buthelezi
Area
  Total
14,799 km2 (5,714 sq mi)
Population
 (2011) [2]
  Total
803,575
  Density54/km2 (140/sq mi)
Racial makeup (2011)
[2]
   Black African 98.0%
   Coloured 0.2%
   Indian/Asian 0.2%
   White 1.4%
First languages (2011)
[2]
   Zulu 94.3%
   English 1.5%
   Afrikaans 1.3%
   Southern Ndebele 1.1%
  Other1.8%
Time zone UTC+2 (SAST)
Municipal codeDC26

The Zululand District Municipality (Zulu : UMasipala wesiFunda seZululand) is one of the 11 districts of the KwaZulu-Natal province of South Africa. Its seat is Ulundi. As of 2011, a majority of its 803,575 inhabitants spoke isiZulu. The district code is DC26.

Contents

Geography

Neighbours

Zululand is surrounded by:

Local municipalities

The district contains the following local municipalities:

Local municipalityPopulation%
Ulundi 212 97226.47%
Nongoma 198 44724.67%
Abaqulusi 191 02023.75%
uPhongolo 119 78614.89%
eDumbe 82 24110.22%

Demographics

The following statistics are from the 2001 census.

LanguagePopulation%
IsiZulu 779,20696.86%
Afrikaans 11,3821.41%
English 5,2460.65%
Sesotho 2,2970.29%
IsiNdebele 1,6840.21%
IsiXhosa 1,1300.14%
Sepedi 9800.12%
SiSwati 9460.12%
Other 9160.11%
Setswana 4090.05%
Xitsonga 1420.02%
Tshivenda 1280.02%

Gender

GenderPopulation%
Female434 24453.98%
Male370 21246.02%

Ethnic group

Ethnic groupPopulation%
African788 55198.02%
White13 7691.71%
Coloured1 5210.19%
Indian/Asian6150.08%

Age

AgePopulation%
000 - 004103 5412%
005 - 009116 19314.44%
010 - 014119 92514.91%
015 - 019111 38313.85%
020 - 02469 6378.66%
025 - 02950 7396.31%
030 - 03440 5145.04%
035 - 03938 7394.82%
040 - 04433 6284.18%
045 - 04927 6973.44%
050 - 05421 7352.70%
055 - 05916 1252.00%
060 - 06416 8252.09%
065 - 06912 3091.53%
070 - 07411 6061.44%
075 - 0796 3900.79%
080 - 0844 9620.62%
085 - 0891 3000.16%
090 - 0946470.08%
095 - 0994400.05%
100 plus1210.02%

Politics

Election results

Election results for Zululand in the South African general election, 2004.

PartyVotes%
Inkatha Freedom Party 169 02877.44%
African National Congress 32 68814.98%
Democratic Alliance 8 8314.05%
African Christian Democratic Party 2 3791.09%
United Democratic Movement 1 0250.47%
Freedom Front Plus 8450.39%
New National Party 5310.24%
Independent Democrats 4830.22%
Azanian People's Organisation 3650.17%
Pan African Congress 2310.11%
Keep It Straight and Simple Party 2200.10%
United Christian Democratic Party 2200.10%
Peace and Justice Congress 2100.10%
Socialist Party of Azania 1880.09%
Christian Democratic Party 1690.08%
TOP 1670.08%
NA 1600.07%
EMSA 1550.07%
Minority Front 1520.07%
UF 1410.06%
New Labour Party 820.04%
Total218 270100.00%

See also

References

  1. "Contact list: Executive Mayors". Government Communication & Information System. Retrieved 26 January 2016.
  2. 1 2 3 "Statistics by place". Statistics South Africa. Retrieved 27 September 2015.