Leeds South | |
---|---|
Borough constituency for the House of Commons | |
![]() Interactive map of boundaries since 2024 | |
![]() Boundary within Yorkshire and the Humber | |
County |
|
Current constituency | |
Created | 2024 |
Member of Parliament | Hilary Benn (Labour) |
Seats | One |
Created from |
|
1885–1983 | |
Seats | One |
Type of constituency | Borough constituency |
Created from | Leeds |
Replaced by | Leeds Central and Morley & Leeds South [1] |
Leeds South is a parliamentary constituency [n 1] in the city of Leeds, West Yorkshire, which returns one Member of Parliament (MP) to the House of Commons of the Parliament of the United Kingdom. The constituency existed from 1885 to 1983 and was recreated in 2024 following the 2023 Periodic Review of Westminster constituencies. [2]
In the 2024 general election, the seat was won by Hilary Benn of the Labour Party, who serves as Secretary of State for Northern Ireland in the government of Keir Starmer. [3] [4] Benn had represented Leeds Central, the main predecessor of Leeds South, since 1999.
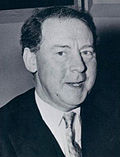
Leeds South was the seat of the former Leader of the Labour Party, the late Hugh Gaitskell, and the former Home Secretary Merlyn Rees.
The constituency was created in 1885 by the Redistribution of Seats Act 1885, and was first used in the general election of that year. Leeds had previously been represented by two MPs (1832–1868) and three MPs (1868–1885). From 1885 it was represented by five single-member constituencies: Leeds Central, Leeds East, Leeds North, Leeds South and Leeds West. The constituencies of Morley, Otley and Pudsey were also created in 1885.
The constituency was abolished for the 1983 general election. It was then split between the re-established constituency of Leeds Central, which included just over half of the seat's boundaries, and the new constituency of Morley and Leeds South, which took slightly under half of the seat's boundaries. [1] After the 1983 general election Leeds was represented by the constituencies of Leeds Central, Leeds East, Leeds North East, Leeds North West, Leeds West and Morley and Leeds South. There were also constituencies of Elmet (created 1983) and Pudsey.
Further to the completion of the 2023 Periodic Review of Westminster constituencies, the seat was re-established for the 2024 general election, formed primarily from the (abolished) constituency of Leeds Central, but excluding the city centre, and including a small part of Leeds East and a very small part of Morley and Outwood. [5] [6] The notional 2019 result for the new seat was Labour. [7]
1885–1918: The Municipal Borough of Leeds wards of East Hunslet, South, and West Hunslet, and part of Bramley ward.
1918–1950: The County Borough of Leeds wards of Holbeck and West Hunslet, and part of New Wortley ward.
1950–1951: The County Borough of Leeds wards of Beeston, Holbeck South, Hunslet Carr and Middleton, and West Hunslet.
1951–1955: The County Borough of Leeds wards of Beeston, Holbeck, Hunslet Carr, and Middleton. [8]
1955–1974: The County Borough of Leeds wards of Beeston, Holbeck, Hunslet Carr, and Middleton.
1974–1983: The County Borough of Leeds wards of Beeston, East Hunslet, Holbeck, Middleton, and West Hunslet.
The City of Leeds wards of Beeston & Holbeck, Burmantofts & Richmond Hill, Hunslet & Riverside, Middleton Park, and Temple Newsam (part). [9]
The part ward of Temple Newsam was transferred from Leeds East, with the bulk of the remainder comprising approximately 72% of the electorate of the abolished Leeds Central seat.
Leeds prior to 1885
Election | Member | Party | |
---|---|---|---|
1885 | Sir Lyon Playfair | Liberal | |
1892 | John Lawson Walton | Liberal | |
1908 | William Middlebrook | Liberal | |
1922 | Henry Charleton | Labour | |
1931 | Noel Whiteside | Conservative | |
1935 | Henry Charleton | Labour | |
1945 | Hugh Gaitskell | Labour | |
1963 | Merlyn Rees | Labour | |
1983 | Constituency abolished |
Leeds Central prior to 2024
Election | Member | Party | |
---|---|---|---|
2024 | Hilary Benn | Labour |
Party | Candidate | Votes | % | ±% | |
---|---|---|---|---|---|
Labour | Hilary Benn | 17,117 | 54.0 | −4.4 | |
Green | Ed Carlisle | 5,838 | 18.4 | +14.6 | |
Conservative | Karen Cooksley | 4,172 | 13.2 | −13.1 | |
SDP | Daniel Whetstone | 1,874 | 5.9 | +5.3 | |
Liberal Democrats | George Sykes | 1,340 | 4.2 | −0.2 | |
Workers Party | Muhammad Azeem | 719 | 2.3 | New | |
CPA | Janet Bickerdike | 341 | 1.1 | New | |
Independent | Niko Omilana | 277 | 0.9 | New | |
Majority | 11,279 | 35.6 | +3.5 | ||
Turnout | 31,678 | 41.7 | −16.2 | ||
Registered electors | 75,953 | ||||
Labour hold | Swing | −9.5 |
2019 notional result [12] | |||
---|---|---|---|
Party | Vote | % | |
Labour | 25,263 | 58.4 | |
Conservative | 11,377 | 26.3 | |
Brexit Party | 2,771 | 6.4 | |
Liberal Democrats | 1,922 | 4.4 | |
Green | 1,635 | 3.8 | |
Others | 281 | 0.6 | |
Turnout | 43,249 | 57.9 | |
Electorate | 74,726 |
Party | Candidate | Votes | % | ±% | |
---|---|---|---|---|---|
Liberal | Lyon Playfair | 5,208 | 64.5 | ||
Conservative | Stuart Cunningham Macaskie | 2,869 | 35.5 | ||
Majority | 2,339 | 29.0 | |||
Turnout | 8,077 | 73.9 | |||
Registered electors | 10,931 | ||||
Liberal win (new seat) |
Playfair was appointed Vice-President of the Committee of the Council on Education, requiring a by-election.
Party | Candidate | Votes | % | ±% | |
---|---|---|---|---|---|
Liberal | Lyon Playfair | Unopposed | |||
Liberal hold |
Party | Candidate | Votes | % | ±% | |
---|---|---|---|---|---|
Liberal | Lyon Playfair | 4,665 | 61.5 | −3.0 | |
Conservative | Thomas Hirst Bracken [15] | 2,924 | 38.5 | +3.0 | |
Majority | 1,741 | 23.0 | −6.0 | ||
Turnout | 7,589 | 69.4 | −4.5 | ||
Registered electors | 10,931 | ||||
Liberal hold | Swing | −3.0 |
Party | Candidate | Votes | % | ±% | |
---|---|---|---|---|---|
Liberal | Lyon Playfair | 4,829 | 59.4 | −2.1 | |
Conservative | Reginald Neville | 3,294 | 40.6 | +2.1 | |
Majority | 1,535 | 18.8 | −4.2 | ||
Turnout | 8,123 | 71.9 | +2.5 | ||
Registered electors | 11,290 | ||||
Liberal hold | Swing | −2.1 |
Party | Candidate | Votes | % | ±% | |
---|---|---|---|---|---|
Liberal | John Walton | 4,414 | 56.0 | −3.4 | |
Conservative | Reginald Neville | 3,466 | 44.0 | +3.4 | |
Majority | 948 | 12.0 | −6.8 | ||
Turnout | 7,880 | 69.8 | −2.1 | ||
Registered electors | 11,290 | ||||
Liberal hold | Swing | −3.4 |
Party | Candidate | Votes | % | ±% | |
---|---|---|---|---|---|
Liberal | John Walton | 4,608 | 47.6 | −11.8 | |
Conservative | Reginald Neville | 4,447 | 46.0 | +5.4 | |
Ind. Labour Party | Alfred Shaw | 622 | 6.4 | New | |
Majority | 161 | 1.6 | −17.2 | ||
Turnout | 9,677 | 81.2 | +9.3 | ||
Registered electors | 11,921 | ||||
Liberal hold | Swing | −8.6 |
Party | Candidate | Votes | % | ±% | |
---|---|---|---|---|---|
Liberal | John Walton | 4,952 | 51.2 | +3.6 | |
Conservative | Reginald Neville | 4,718 | 48.8 | +2.8 | |
Majority | 234 | 2.4 | +0.8 | ||
Turnout | 9,670 | 71.9 | −9.3 | ||
Registered electors | 13,442 | ||||
Liberal hold | Swing | +0.4 |
Party | Candidate | Votes | % | ±% | |
---|---|---|---|---|---|
Liberal | John Walton | 6,200 | 50.2 | −1.0 | |
Labour Repr. Cmte. | Albert E. Fox | 4,030 | 32.6 | New | |
Conservative | Henry Cameron-Ramsay-Fairfax-Lucy | 2,126 | 17.2 | −31.6 | |
Majority | 2,170 | 17.6 | +15.2 | ||
Turnout | 12,356 | 81.7 | +9.8 | ||
Registered electors | 15,119 | ||||
Liberal hold | Swing | +15.3 |
Party | Candidate | Votes | % | ±% | |
---|---|---|---|---|---|
Liberal | William Middlebrook | 5,274 | 41.7 | −8.5 | |
Conservative | Reginald Neville | 4,915 | 38.9 | +21.7 | |
Labour | Albert E. Fox | 2,451 | 19.4 | −13.2 | |
Majority | 359 | 2.8 | −14.8 | ||
Turnout | 12,640 | 82.5 | +0.8 | ||
Registered electors | 15,321 | ||||
Liberal hold | Swing | +2.4 |
Party | Candidate | Votes | % | ±% | |
---|---|---|---|---|---|
Liberal | William Middlebrook | 8,969 | 67.3 | +17.1 | |
Conservative | William Nicholson | 4,366 | 32.7 | +15.5 | |
Majority | 4,603 | 34.6 | +17.0 | ||
Turnout | 13,335 | 84.8 | +3.1 | ||
Liberal hold | Swing | +15.9 |
Party | Candidate | Votes | % | ±% | |
---|---|---|---|---|---|
Liberal | William Middlebrook | 6,064 | 48.2 | −19.1 | |
Conservative | William Nicholson | 3,804 | 30.3 | −2.4 | |
Labour | John Badlay | 2,706 | 21.5 | New | |
Majority | 2,260 | 17.9 | −16.7 | ||
Turnout | 12,574 | 80.0 | −4.8 | ||
Liberal hold | Swing |
General Election 1914–15:
Another General Election was required to take place before the end of 1915. The political parties had been making preparations for an election to take place and by July 1914, the following candidates had been selected;
Party | Candidate | Votes | % | ±% | |
---|---|---|---|---|---|
C | Liberal | William Middlebrook | 10,609 | 60.6 | +12.4 |
Labour | Frank Fountain | 5,510 | 31.5 | +10.0 | |
Independent | James A Brook* | 1,377 | 7.9 | New | |
Majority | 5,099 | 29.1 | +11.2 | ||
Turnout | 17,496 | 48.8 | −31.2 | ||
Registered electors | 35,843 | ||||
Liberal hold | Swing | +1.2 | |||
Cindicates candidate endorsed by the coalition government. |
* Brook was supported by the three local branches of National Association of Discharged Sailors and Soldiers, National Federation of Discharged and Demobilized Sailors and Soldiers and Comrades of the Great War.
Party | Candidate | Votes | % | ±% | |
---|---|---|---|---|---|
Labour | Henry Charleton | 13,210 | 53.7 | +22.2 | |
Liberal | William Middlebrook | 11,380 | 46.3 | −14.3 | |
Majority | 1,830 | 7.4 | N/A | ||
Turnout | 24,590 | 69.8 | +21.0 | ||
Registered electors | 35,252 | ||||
Labour gain from Liberal | Swing | +18.3 |
Party | Candidate | Votes | % | ±% | |
---|---|---|---|---|---|
Labour | Henry Charleton | 11,705 | 44.2 | −9.5 | |
Unionist | Reginald Neville | 7,679 | 29.0 | New | |
Liberal | Granville Gibson | 7,083 | 26.8 | −19.5 | |
Majority | 4,026 | 15.2 | +7.8 | ||
Turnout | 26,467 | 74.1 | +4.3 | ||
Registered electors | 35,719 | ||||
Labour hold | Swing | +5.0 |
Party | Candidate | Votes | % | ±% | |
---|---|---|---|---|---|
Labour | Henry Charleton | 12,799 | 46.3 | +2.1 | |
Unionist | B.T. Graham Ford | 11,008 | 39.9 | +10.9 | |
Liberal | Frank Geary | 3,801 | 13.8 | −13.0 | |
Majority | 1,791 | 6.4 | −8.8 | ||
Turnout | 27,608 | 76.5 | +2.4 | ||
Registered electors | 36,085 | ||||
Labour hold | Swing | −4.4 |
Party | Candidate | Votes | % | ±% | |
---|---|---|---|---|---|
Labour | Henry Charleton | 18,043 | 52.5 | +6.2 | |
Unionist | B.T. Graham Ford | 9,433 | 27.5 | −12.4 | |
Liberal | Ernest Kilburn Scott | 6,884 | 20.0 | +6.2 | |
Majority | 8,610 | 25.0 | +18.6 | ||
Turnout | 34,360 | 76.2 | −0.3 | ||
Registered electors | 45,084 | ||||
Labour hold | Swing | +9.3 |
Party | Candidate | Votes | % | ±% | |
---|---|---|---|---|---|
Conservative | Noel Whiteside | 14,881 | 42.12 | ||
Labour | Henry Charleton | 14,156 | 40.07 | ||
Liberal | Frederick L. Boult | 6,291 | 17.81 | ||
Majority | 725 | 2.05 | N/A | ||
Turnout | 35,328 | 77.56 | |||
Conservative gain from Labour | Swing |
Party | Candidate | Votes | % | ±% | |
---|---|---|---|---|---|
Labour | Henry Charleton | 15,223 | 46.03 | ||
Conservative | Noel Whiteside | 14,207 | 42.96 | ||
Social Credit | Wilfred Townend | 3,642 | 11.01 | New | |
Majority | 1,016 | 3.07 | N/A | ||
Turnout | 33,072 | 73.68 | |||
Labour gain from Conservative | Swing |
General Election 1939–40:
Another General Election was required to take place before the end of 1940. The political parties had been making preparations for an election to take place and by the Autumn of 1939, the following candidates had been selected;
Party | Candidate | Votes | % | ±% | |
---|---|---|---|---|---|
Labour | Hugh Gaitskell | 17,899 | 61.03 | ||
Conservative | Arthur Maxwell Ramsden | 7,497 | 25.56 | ||
Liberal | William Barford | 3,933 | 13.41 | New | |
Majority | 10,402 | 35.47 | |||
Turnout | 29,329 | 75.95 | |||
Labour hold | Swing |
Party | Candidate | Votes | % | ±% | |
---|---|---|---|---|---|
Labour | Hugh Gaitskell | 29,795 | 61.11 | ||
Conservative | B.H. Wood | 14,436 | 29.61 | ||
Liberal | Edgar Meeks | 4,525 | 9.28 | ||
Majority | 15,359 | 31.50 | |||
Turnout | 48,756 | 84.61 | |||
Labour hold | Swing |
Party | Candidate | Votes | % | ±% | |
---|---|---|---|---|---|
Labour | Hugh Gaitskell | 30,712 | 65.06 | ||
Conservative | Winifred D. Brown | 16,493 | 34.94 | ||
Majority | 14,219 | 30.12 | |||
Turnout | 47,205 | 82.19 | |||
Labour hold | Swing |
Party | Candidate | Votes | % | ±% | |
---|---|---|---|---|---|
Labour | Hugh Gaitskell | 25,833 | 65.15 | ||
Conservative | Winifred D. Brown | 13,817 | 34.85 | ||
Majority | 12,016 | 30.30 | |||
Turnout | 39,650 | 72.85 | |||
Labour hold | Swing |
Party | Candidate | Votes | % | ±% | |
---|---|---|---|---|---|
Labour | Hugh Gaitskell | 24,442 | 58.6 | −6.5 | |
Conservative | John Francis William Addey | 12,956 | 31.0 | −3.8 | |
Liberal | John Brian Meeks | 4,340 | 10.4 | New | |
Majority | 11,486 | 27.6 | −2.7 | ||
Turnout | 41,738 | 79.0 | +6.2 | ||
Labour hold | Swing |
Party | Candidate | Votes | % | ±% | |
---|---|---|---|---|---|
Labour | Merlyn Rees | 18,785 | 62.93 | +4.37 | |
Conservative | John Udal | 5,996 | 20.09 | −10.95 | |
Liberal | Brian Walsh | 4,399 | 14.74 | +4.34 | |
Communist | Bert Ramelson | 670 | 2.24 | New | |
Majority | 12,789 | 42.84 | +15.32 | ||
Turnout | 29,850 | ||||
Labour hold | Swing |
Party | Candidate | Votes | % | ±% | |
---|---|---|---|---|---|
Labour | Merlyn Rees | 22,339 | 63.12 | ||
Conservative | Percival Arthur Woodward | 12,123 | 34.26 | ||
Communist | Bert Ramelson | 928 | 2.62 | N/A | |
Majority | 10,997 | 28.86 | |||
Turnout | 35,390 | 72.00 | |||
Labour hold | Swing |
Party | Candidate | Votes | % | ±% | |
---|---|---|---|---|---|
Labour | Merlyn Rees | 23,171 | 68.76 | ||
Conservative | Percival Arthur Woodward | 9,813 | 29.12 | ||
Communist | Bert Ramelson | 714 | 2.12 | ||
Majority | 13,358 | 39.64 | |||
Turnout | 33,698 | 68.11 | |||
Labour hold | Swing |
Party | Candidate | Votes | % | ±% | |
---|---|---|---|---|---|
Labour | Merlyn Rees | 19,536 | 59.82 | ||
Conservative | Gavin K. Macpherson | 9,311 | 28.51 | ||
Liberal | Stephen Cooksey | 3,810 | 11.67 | New | |
Majority | 10,225 | 31.31 | |||
Turnout | 32,657 | 65.95 | |||
Labour hold | Swing |
Party | Candidate | Votes | % | ±% | |
---|---|---|---|---|---|
Labour | Merlyn Rees | 21,365 | 55.24 | ||
Liberal | Denis Pedder | 9,505 | 24.57 | ||
Conservative | Peter David Harmer | 7,810 | 20.19 | ||
Majority | 11,860 | 30.67 | |||
Turnout | 38,680 | 73.95 | |||
Labour hold | Swing |
Party | Candidate | Votes | % | ±% | |
---|---|---|---|---|---|
Labour | Merlyn Rees | 21,653 | 64.44 | ||
Conservative | Thomas Neil Metcalfe Stow | 6,388 | 19.01 | ||
Liberal | John Adams | 5,563 | 16.55 | ||
Majority | 15,265 | 45.43 | |||
Turnout | 33,604 | 63.76 | |||
Labour hold | Swing |
Party | Candidate | Votes | % | ±% | |
---|---|---|---|---|---|
Labour | Merlyn Rees | 22,388 | 65.02 | ||
Conservative | R. Ratcliffe | 8,058 | 23.40 | ||
Liberal | F. Hurst | 3,568 | 10.36 | ||
National Front | B. Spink | 416 | 1.21 | New | |
Majority | 14,330 | 41.62 | |||
Turnout | 35,430 | 68.70 | |||
Labour hold | Swing |