This article includes a list of general references, but it lacks sufficient corresponding inline citations .(December 2010) |
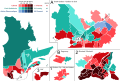
![Number of seats won by major parties at each election through 2014
.mw-parser-output figure[typeof="mw:File/Thumb"] .image-key>ol{margin-left:1.3em;margin-top:0}.mw-parser-output figure[typeof="mw:File/Thumb"] .image-key>ul{margin-top:0}.mw-parser-output figure[typeof="mw:File/Thumb"] .image-key li{page-break-inside:avoid;break-inside:avoid-column}@media(min-width:300px){.mw-parser-output figure[typeof="mw:File/Thumb"] .image-key,.mw-parser-output figure[typeof="mw:File/Thumb"] .image-key-wide{column-count:2}.mw-parser-output figure[typeof="mw:File/Thumb"] .image-key-narrow{column-count:1}}@media(min-width:450px){.mw-parser-output figure[typeof="mw:File/Thumb"] .image-key-wide{column-count:3}}
.mw-parser-output .plainlist ol,.mw-parser-output .plainlist ul{line-height:inherit;list-style:none;margin:0;padding:0}.mw-parser-output .plainlist ol li,.mw-parser-output .plainlist ul li{margin-bottom:0}
.mw-parser-output .legend{page-break-inside:avoid;break-inside:avoid-column}.mw-parser-output .legend-color{display:inline-block;min-width:1.25em;height:1.25em;line-height:1.25;margin:1px 0;text-align:center;border:1px solid black;background-color:transparent;color:black}.mw-parser-output .legend-text{}
Conservative
Liberal
Union Nationale
Parti Quebecois
Independent
ADQ
Other QC elections2.gif](http://upload.wikimedia.org/wikipedia/commons/thumb/a/a9/QC_elections2.gif/500px-QC_elections2.gif)
- Conservative
- Liberal
- Union Nationale
- Parti Québécois
- Independent
- ADQ
- Other

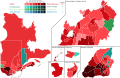
This article provides a summary of results for the general elections to the Canadian province of Quebec's unicameral legislative body, the National Assembly of Quebec (and its predecessor, the Legislative Assembly of Quebec). The number of seats has generally increased over time, from 65 for the first six elections, to the current high of 125.
Contents
The chart on the upper right shows the information graphically, with the most recent elections towards the right.
The Conservative party (blue) in 1936 merged into the Union Nationale (now defunct). The 1970s saw the arrival of the sovereignist Parti Québécois, to be followed by Québec Solidaire and the Coalition Avenir Québec (CAQ) in 2006 and 2011, respectively.
This article only covers elections since the Canadian Confederation in 1867, when Quebec was created as one of Canada's provinces. For Quebec's first 15 elections as Lower Canada from 1792 to 1840, see Legislative Assembly of Lower Canada. For the 8 joint elections of Ontario and Quebec as the Province of Canada, from 1840 to 1867, see list of elections in the Province of Canada.