Statistics Sweden
Average values for 5-year periods. By default the table is sorted by arithmetic mean for 2020-2024. Some values are rounded.
| county | 2014-2018 | change | 2019-2023 | change | 2020-2024 | |||||||||
|---|---|---|---|---|---|---|---|---|---|---|---|---|---|---|
| male | female | sex gap | arith. mean | male | female | sex gap | arith. mean | male | female | sex gap | arith. mean | |||
| Sweden | 80.55 | 84.10 | 3.55 | 82.33 | 0.62 | 81.21 | 84.69 | 3.48 | 82.95 | 0.16 | 81.40 | 84.81 | 3.41 | 83.11 |
| Halland County | 81.52 | 84.78 | 3.26 | 83.15 | 0.88 | 82.52 | 85.53 | 3.01 | 84.03 | 0.08 | 82.64 | 85.57 | 2.93 | 84.11 |
| Stockholm County | 81.04 | 84.56 | 3.52 | 82.80 | 0.78 | 81.74 | 85.41 | 3.67 | 83.58 | 0.24 | 82.07 | 85.57 | 3.50 | 83.82 |
| Uppsala County | 81.38 | 84.65 | 3.27 | 83.02 | 0.59 | 82.00 | 85.22 | 3.22 | 83.61 | 0.06 | 82.06 | 85.29 | 3.23 | 83.67 |
| Kronoberg County | 81.56 | 84.73 | 3.17 | 83.14 | 0.31 | 81.96 | 84.95 | 2.99 | 83.45 | 0.09 | 82.09 | 85.00 | 2.91 | 83.55 |
| Jönköping County | 81.00 | 84.54 | 3.54 | 82.77 | 0.55 | 81.55 | 85.08 | 3.53 | 83.31 | 0.16 | 81.75 | 85.19 | 3.44 | 83.47 |
| Gotland County | 80.43 | 84.18 | 3.75 | 82.31 | 1.04 | 81.32 | 85.38 | 4.06 | 83.35 | 0.12 | 81.40 | 85.53 | 4.13 | 83.47 |
| Dalarna County | 80.47 | 83.82 | 3.35 | 82.14 | 0.84 | 81.20 | 84.76 | 3.56 | 82.98 | 0.16 | 81.51 | 84.78 | 3.27 | 83.14 |
| Kalmar County | 80.18 | 83.88 | 3.70 | 82.03 | 1.05 | 81.24 | 84.91 | 3.67 | 83.08 | 0.06 | 81.33 | 84.95 | 3.62 | 83.14 |
| Östergötland County | 80.78 | 84.20 | 3.42 | 82.49 | 0.47 | 81.34 | 84.57 | 3.23 | 82.95 | 0.13 | 81.41 | 84.76 | 3.35 | 83.08 |
| Västra Götaland County | 80.53 | 84.07 | 3.54 | 82.30 | 0.54 | 81.11 | 84.57 | 3.46 | 82.84 | 0.16 | 81.26 | 84.75 | 3.49 | 83.00 |
| Skåne County | 80.59 | 84.22 | 3.63 | 82.41 | 0.46 | 81.14 | 84.59 | 3.45 | 82.86 | 0.14 | 81.32 | 84.68 | 3.36 | 83.00 |
| Örebro County | 79.91 | 84.03 | 4.12 | 81.97 | 0.66 | 80.71 | 84.55 | 3.84 | 82.63 | 0.20 | 80.99 | 84.67 | 3.68 | 82.83 |
| Västerbotten County | 80.36 | 83.68 | 3.32 | 82.02 | 0.68 | 81.16 | 84.24 | 3.08 | 82.70 | 0.05 | 81.23 | 84.26 | 3.03 | 82.75 |
| Värmland County | 79.75 | 83.80 | 4.05 | 81.78 | 0.83 | 80.71 | 84.50 | 3.79 | 82.61 | 0.10 | 80.83 | 84.59 | 3.76 | 82.71 |
| Jämtland County | 80.04 | 83.54 | 3.50 | 81.79 | 0.63 | 80.70 | 84.15 | 3.45 | 82.42 | 0.26 | 81.11 | 84.26 | 3.15 | 82.69 |
| Västmanland County | 80.33 | 83.87 | 3.54 | 82.10 | 0.31 | 80.53 | 84.29 | 3.76 | 82.41 | 0.25 | 80.87 | 84.44 | 3.57 | 82.66 |
| Blekinge County | 79.77 | 83.84 | 4.07 | 81.81 | 0.76 | 81.02 | 84.12 | 3.10 | 82.57 | 0.08 | 81.08 | 84.22 | 3.14 | 82.65 |
| Södermanland County | 80.03 | 83.78 | 3.75 | 81.91 | 0.38 | 80.61 | 83.95 | 3.34 | 82.28 | 0.16 | 80.79 | 84.08 | 3.29 | 82.44 |
| Gävleborg County | 79.54 | 83.05 | 3.51 | 81.30 | 0.74 | 80.22 | 83.85 | 3.63 | 82.03 | 0.16 | 80.46 | 83.92 | 3.46 | 82.19 |
| Norrbotten County | 79.14 | 83.20 | 4.06 | 81.17 | 0.56 | 79.95 | 83.52 | 3.57 | 81.73 | 0.22 | 80.10 | 83.82 | 3.72 | 81.96 |
| Västernorrland County | 79.54 | 83.00 | 3.46 | 81.27 | 0.54 | 80.09 | 83.52 | 3.43 | 81.81 | 0.11 | 80.09 | 83.74 | 3.65 | 81.92 |
Data source: Statistics Sweden (SCB). [6] [7]
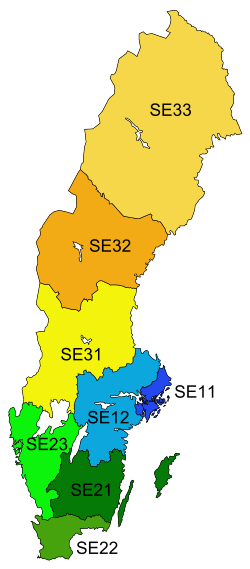
Maps of division of Sweden into counties and NUTS-2 regions:
|  |  |


