Magareng Local Municipality

Last updated
Magareng
Magareng CoA.png
Map of the Northern Cape with Magareng highlighted (2011).svg
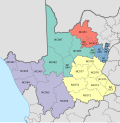
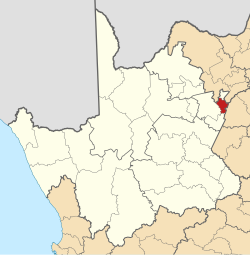
Location in the Northern Cape
Coordinates: 28°10′S24°50′E / 28.167°S 24.833°E / -28.167; 24.833
Country South Africa
Province Northern Cape
District Frances Baard
Seat Warrenton
Wards 6
Government
[1]
  Type Municipal council
  MayorNeo Mase
Area
  Total
1,542 km2 (595 sq mi)
Population
 (2022) [2]
  Total
26,816
  Density17/km2 (45/sq mi)
Racial makeup (2022)
[2]
   Black African 74.3%
   Coloured 14.2%
   Indian/Asian 1.1%
   White 10.4%
First languages (2011)
[3]
   Tswana 67.2%
   Afrikaans 21.2%
   Xhosa 3.6%
   Sotho 2.2%
  Other5.8%
Time zone UTC+2 (SAST)
Municipal codeNC093

Magareng Municipality (Tswana : Mmasepala wa Magareng; Afrikaans : Magareng Munisipaliteit) is a local municipality within the Frances Baard District Municipality, in the Northern Cape province of South Africa.

Contents

Magareng is a Setswana name meaning "in the middle". The name reflects the geographic location of the municipality in relation to other areas. [4]

Main places

The 2011 census divided the municipality into the following main places: [5]

PlaceCodeArea (km2)Population
Ikutseng 385001 4.916,683
Warrenton 385002 26.85,905
Remainder of the municipality 385003 1,510.01,616
Total1,541.724,204

Politics

The municipal council consists of eleven members elected by mixed-member proportional representation. Six councillors are elected by first-past-the-post voting in six wards, while the remaining five are chosen from party lists so that the total number of party representatives is proportional to the number of votes received. In the election of 1 November 2021 the African National Congress (ANC) won a majority of six seats on the council. The following table shows the results of the election. [6] [7]

Magareng local election, 1 November 2021
PartyVotesSeats
WardListTotal %WardListTotal
African National Congress 2,9893,1466,13550.3%516
Economic Freedom Fighters 1,0641,4002,46420.2%022
Democratic Alliance 7568591,61513.3%112
Patriotic Alliance 3784778557.0%011
Independent candidates 7167165.9%00
Freedom Front Plus 1591603192.6%000
African Christian Democratic Party 3646820.7%000
Total6,0986,08812,1866511
Valid votes6,0986,08812,18698.2%
Spoilt votes 1061222281.8%
Total votes cast6,2046,21012,414
Voter turnout6,213
Registered voters11,644
Turnout percentage53.4%

References

  1. "Contact list: Executive Mayors". Government Communication & Information System. Archived from the original on 14 July 2010. Retrieved 22 February 2012.
  2. 1 2 "Statistics by place". Statistics South Africa. Retrieved 17 February 2025.
  3. "Statistics by place". Statistics South Africa. Retrieved 27 September 2015.
  4. South African Languages - Place names
  5. "Magareng Local Municipality". Census 2011.
  6. "Results Summary - All Ballots" (PDF). Electoral Commission of South Africa. 8 November 2021. Retrieved 12 November 2021.
  7. "Seat Calculation Detail" (PDF). Electoral Commission of South Africa. 8 November 2021. Retrieved 12 November 2021.