ZF Mgcawu District Municipality

Last updated
ZF Mgcawu
Benede Oranje
Map of South Africa with Siyanda highlighted (2011).svg
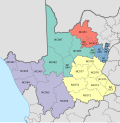
Location in South Africa
Coordinates: 28°0′S21°30′E / 28.000°S 21.500°E / -28.000; 21.500
Country South Africa
Province Northern Cape
Seat Upington
Local municipalities
Government
[1]
  Type Municipal council
  MayorGift van Staden
Area
  Total
102,524 km2 (39,585 sq mi)
Population
 (2011) [2]
  Total
236,783
  Density2.3/km2 (6.0/sq mi)
Racial makeup (2011)
[2]
   Black African 29.4%
   Coloured 60.4%
   Indian/Asian 0.7%
   White 8.2%
First languages (2011)
[2]
   Afrikaans 76.4%
   Tswana 15.8%
   Xhosa 2.7%
   English 1.8%
  Other3.3%
Time zone UTC+2 (SAST)
Municipal codeDC8

The ZF Mgcawu District Municipality (Afrikaans : ZF Mgcawu-distriksmunisipaliteit; Tswana : Mmasepala wa Sedika wa ZF Mgcawu), known before 1 July 2013 as the Siyanda District Municipality, [3] is one of the 5 districts of the Northern Cape province of South Africa. The seat of the municipality is Upington. As of 2011, the majority (76%) of its 236,783 residents speak Afrikaans. [4] The district code is DC8.

Contents

The ZF Mgcawu District Municipality is named after Upington's first post-1994 democratically elected mayor, Zwelentlanga Fatman Mgcawu (1958–2001). The previous name Siyanda means "we are growing".

Geography

Neighbours

ZF Mgcawu is surrounded by:

Local municipalities

The district contains the following local municipalities:[ needs update ]

Local municipalityPopulation%Dominant language
//Khara Hais 73 78635.16% Afrikaans
Kai !Garib 57 68927.49%Afrikaans
Tsantsabane 31 01014.77%Afrikaans
!Kheis 16 0297.64%Afrikaans
Kgatelopele 15 4487.36%Afrikaans
Mier 6 8503.26%Afrikaans
District Management Area 9 0834.33%

Demographics

The following statistics are from the 2001 census.

LanguagePopulation%
Afrikaans 171 37181.65%
Setswana 28 59513.62%
IsiXhosa 5 3932.57%
English 1 6320.78%
Sesotho 1 3760.66%
Other 8220.39%
IsiZulu 2660.13%
Sepedi 1010.05%
IsiNdebele 990.05%
Tshivenda 970.05%
SiSwati 760.04%
Xitsonga 670.03%

Gender

GenderPopulation%
Female107 48051.21%
Male102 40348.79%

Ethnic group

Ethnic groupPopulation%
Coloured133 71163.71%
Black African51 35324.47%
White24 63311.74%
Indian/Asian1860.09%

Age

AgePopulation%
000 - 00422 03810.50%
005 - 00921 68910.33%
010 - 01421 34110.17%
015 - 01921 75310.36%
020 - 02419 1019.10%
025 - 02918 1658.65%
030 - 03416 4037.82%
035 - 03914 8377.07%
040 - 04413 0016.19%
045 - 04910 5925.05%
050 - 0548 4094.01%
055 - 0596 3433.02%
060 - 0645 5042.62%
065 - 0694 2262.01%
070 - 0742 7201.30%
075 - 0791 8310.87%
080 - 0841 1640.55%
085 - 0895120.24%
090 - 0942090.10%
095 - 099330.02%
100 plus120.01%

Politics

Election results

Election results for Siyanda in the South African general election, 2004.

PartyVotes%
African National Congress 50 82667.53%
Independent Democrats 7 74710.29%
Democratic Alliance 6 7769.00%
New National Party 5 4017.18%
African Christian Democratic Party 1 2991.73%
Freedom Front Plus 1 2691.69%
United Democratic Movement 6900.92%
Azanian People's Organisation 3720.49%
Pan African Congress 1830.24%
United Christian Democratic Party 1600.21%
Inkhata Freedom Party 1100.15%
EMSA 660.09%
NA 650.09%
PJC 590.08%
KISS 480.06%
SOPA 450.06%
UF 360.05%
CDP 320.04%
NLP 320.04%
TOP 280.04%
Minority Front 200.03%
Total75 264100.00%

References

  1. "Contact list: Executive Mayors". Government Communication & Information System. Retrieved 26 January 2016.
  2. 1 2 3 "Statistics by place". Statistics South Africa. Retrieved 27 September 2015.
  3. "Siyanda District Municipality Renamed". Kathu Gazette. Retrieved 18 July 2013.
  4. Municipal Profiles