Umsobomvu Local Municipality

Last updated

Umsobomvu
Umsobomvu CoA.png
Map of the Northern Cape with Umsobomvu highlighted (2011).svg
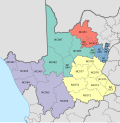
Location in the Northern Cape
Coordinates: 30°50′S25°10′E / 30.833°S 25.167°E / -30.833; 25.167
Country South Africa
Province Northern Cape
District Pixley ka Seme
Seat Colesberg
Wards 7
Government
[1]
  Type Municipal council
  MayorMzwandile Simon Toto
Area
  Total
6,819 km2 (2,633 sq mi)
Population
 (2022) [2]
  Total
29,555
  Density4.3/km2 (11/sq mi)
Racial makeup (2022)
[2]
   Black African 62.8%
   Coloured 31.5%
   Indian/Asian 0.5%
   White 5.2%
First languages (2011)
[2]
   Xhosa 55.2%
   Afrikaans 38.6%
   Sotho 1.9%
   English 1.8%
  Other2.5%
Time zone UTC+2 (SAST)
Municipal codeNC072

Umsobomvu Municipality (Xhosa : uMasipala wase Umsobomvu; Afrikaans : Umsobomvu Munisipaliteit) is a local municipality within the Pixley ka Seme District Municipality, in the Northern Cape province of South Africa.

Contents

Main places

The 2011 census divided the municipality into the following main places: [3]

PlaceCodeArea (km2)PopulationMost spoken language
Colesberg 370004 174.816,869Xhosa
Kwazamuxolo 370006 0.73,334Xhosa
Masizakhe 370002 0.11,101Xhosa
Norvalspont 370001 0.897Afrikaans
Noupoort 370005 9.44,514Afrikaans
Remainder 370003 6,632.62,461Afrikaans
Total6,818.528,376Xhosa

Politics

The municipal council consists of thirteen members elected by mixed-member proportional representation. Seven councillors are elected by first-past-the-post voting in seven wards, while the remaining six are chosen from party lists so that the total number of party representatives is proportional to the number of votes received. In the election of 1 November 2021 the African National Congress (ANC) won a majority of seven seats on the council. The following table shows the results of the election. [4] [5]

Umsobomvu local election, 1 November 2021
PartyVotesSeats
WardListTotal %WardListTotal
African National Congress 4,8574,8599,71651.8%527
Umsobomvu Residents Association2,7382,7535,49129.3%224
Democratic Alliance 1,1631,1492,31212.3%022
Freedom Front Plus 3433356783.6%000
Economic Freedom Fighters 1771633401.8%000
Patriotic Alliance 1011082091.1%000
Independent candidates 110.0%00
Total9,3809,36718,7477613
Valid votes9,3809,36718,74798.3%
Spoilt votes 1551613161.7%
Total votes cast9,5359,52819,063
Voter turnout9,543
Registered voters14,874
Turnout percentage64.2%

References

  1. "Contact list: Executive Mayors". Government Communication & Information System. Archived from the original on 14 July 2010. Retrieved 22 February 2012.
  2. 1 2 3 "Statistics by place". Statistics South Africa. Retrieved 17 February 2025.
  3. "Umsobomvu Local Municipality". Census 2011.
  4. "Results Summary - All Ballots" (PDF). Electoral Commission of South Africa. 8 November 2021. Retrieved 13 November 2021.
  5. "Seat Calculation Detail" (PDF). Electoral Commission of South Africa. 8 November 2021. Retrieved 13 November 2021.