Kgatelopele | |
---|---|
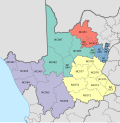
![]() Location in the Northern Cape | |
Coordinates: 28°15′S23°40′E / 28.250°S 23.667°E | |
Country | South Africa |
Province | Northern Cape |
District | ZF Mgcawu |
Seat | Daniëlskuil |
Wards | 6 |
Government | |
• Type | Municipal council |
• Mayor | Norman Prince |
Area | |
• Total | 2,478 km2 (957 sq mi) |
Population (2022) [2] | |
• Total | 19,854 |
• Density | 8.0/km2 (21/sq mi) |
Racial makeup (2022) | |
• Black African | 47.7% |
• Coloured | 40.0% |
• Indian/Asian | 0.7% |
• White | 11.6% |
First languages (2011) | |
• Afrikaans | 58.3% |
• Tswana | 32.7% |
• English | 2.9% |
• Xhosa | 1.6% |
• Other | 4.5% |
Time zone | UTC+2 (SAST) |
Municipal code | NC086 |
Kgatelopele Municipality (Afrikaans : Kgatelopele Munisipaliteit; Tswana : Mmasepala wa Kgatelopele) is a local municipality within the ZF Mgcawu District Municipality, in the Northern Cape province of South Africa. Kgatelopele is a Setswana name meaning "progress". [4]
The 2001 census divided the municipality into the following main places: [5]
Place | Code | Area (km2) | Population |
---|---|---|---|
Danielskuil | 32001 | 22.12 | 6,730 |
Five Mission | 32002 | 1.70 | 350 |
Lime Acres | 32004 | 755.53 | 3,723 |
Tlhakalatlou | 32005 | 0.47 | 3,337 |
Remainder of the municipality | 32003 | 2,870.45 | 1,305 |
According to the 2022 South African census, the municipality had a population of 19,854 people. Of those, 47.7% identified as "Black African," 40.0% as "Coloured," and 11.6% as "White." [6]
The municipal council consists of eleven members elected by mixed-member proportional representation. Six councillors are elected by first-past-the-post voting in six wards, while the remaining five are chosen from party lists so that the total number of party representatives is proportional to the number of votes received. In the election of 1 November 2021 no party obtained a majority on the council. The following table shows the results of the election. [7] [8]
Kgatelopele local election, 1 November 2021 | ||||||||
---|---|---|---|---|---|---|---|---|
Party | Votes | Seats | ||||||
Ward | List | Total | % | Ward | List | Total | ||
African National Congress | 1,939 | 2,006 | 3,945 | 43.7% | 5 | 0 | 5 | |
Patriotic Alliance | 810 | 858 | 1,668 | 18.5% | 0 | 2 | 2 | |
Democratic Alliance | 762 | 770 | 1,532 | 17.0% | 1 | 1 | 2 | |
Economic Freedom Fighters | 384 | 442 | 826 | 9.1% | 0 | 1 | 1 | |
Freedom Front Plus | 397 | 381 | 778 | 8.6% | 0 | 1 | 1 | |
Independent candidates | 200 | – | 200 | 2.2% | 0 | – | 0 | |
Azanian People's Organisation | 34 | 47 | 81 | 0.9% | 0 | 0 | 0 | |
Total | 4,526 | 4,504 | 9,030 | 6 | 5 | 11 | ||
Valid votes | 4,526 | 4,504 | 9,030 | 97.8% | ||||
Spoilt votes | 89 | 117 | 206 | 2.2% | ||||
Total votes cast | 4,615 | 4,621 | 9,236 | |||||
Voter turnout | 4,621 | |||||||
Registered voters | 9,518 | |||||||
Turnout percentage | 48.6% |
'