Namakwa | |
|---|---|
 Seal | |
 Location in South Africa | |
| Coordinates: 30°30′S19°30′E / 30.500°S 19.500°E | |
| Country | South Africa |
| Province | Northern Cape |
| Seat | Springbok |
| Local municipalities | |
| Government | |
| • Type | Municipal council |
| • Mayor | Mervin Cloete |
| Area | |
• Total | 126,836 km2 (48,972 sq mi) |
| Population (2011) [2] | |
• Total | 115,842 |
| • Density | 0.913321/km2 (2.36549/sq mi) |
| Racial makeup (2011) | |
| • Coloured | 83.2% |
| • White | 8.7% |
| • Black African | 6.8% |
| • Indian/Asian | 0.5% |
| First languages (2011) | |
| • Afrikaans | 93.9% |
| • Tswana | 1.7% |
| • Xhosa | 1.5% |
| • English | 1.2% |
| • Other | 1.7% |
| Time zone | UTC+2 (SAST) |
| Municipal code | DC6 |
The Namakwa District Municipality (Afrikaans : Namakwa-distriksmunisipaliteit) is one of the 5 districts of the Northern Cape province of South Africa. The seat of Namakwa is Springbok and the region is also known as Little Namaqualand. As of 2011, a majority of its 108,118 residents speak Afrikaans. The district code is DC6.
Contents
- Geography
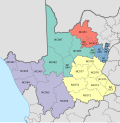
- Neighbours
- Local municipalities
- Demographics
- Gender
- Ethnic group
- Age
- Politics
- Election results
- References
- External links
Community-based climate-adaptation projects in the district have been supported through the Community Adaptation Small Grants Facility, with Conservation South Africa serving as the Namakwa facilitating agency. [3] [4]