West Coast District Municipality

Last updated
West Coast
Weskus
West Coast CoA.png
Map of South Africa with West Coast highlighted (2011).svg
Location in South Africa
Map of the West Coast district with local municipalities labelled.svg
Local municipalities within the West Coast
Coordinates: 32°30′S18°45′E / 32.500°S 18.750°E / -32.500; 18.750
Country South Africa
Province Western Cape
Seat Moorreesburg
Local municipalities
Government
[1]
  Type Municipal council
  MayorRoelof Strydom [2] (DA)
Area
  Total
31,119 km2 (12,015 sq mi)
Population
 (2011) [3]
  Total
391,766
  Density13/km2 (33/sq mi)
Racial makeup (2011)
[3]
   Black African 16.4%
   Coloured 66.6%
   Indian/Asian 0.6%
   White 15.7%
First languages (2011)
[3]
   Afrikaans 83.7%
   Xhosa 8.6%
   English 4.0%
   Sotho 1.3%
  Other2.4%
Time zone UTC+2 (SAST)
Municipal codeDC1

The West Coast District Municipality (Afrikaans : Weskus-distriksmunisipaliteit; Xhosa : uMasipala weSithili soNxweme oluseNtshona) is a district municipality located in the Western Cape province of South Africa. Its municipality code is DC1. Moorreesburg is the seat of the district. As of 2011, it had a total population of 391,766. [3]

Contents

Geography

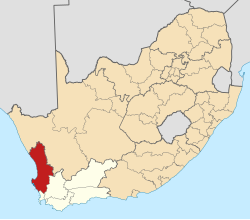
The municipality, which covers an area of 31,119 square kilometres (12,015 sq mi), lies along the Atlantic coast of the Western Cape, extending approximately 350 kilometres (220 mi) from north to south. It includes the coastal plain and is generally bounded on the east by the mountains of the escarpment, though in the case of the Cederberg mountains the border passes further to the east, along the Doring River, so that the mountains are included in the municipal area. The principal rivers in the area are the Berg River, which drains the southern part of the municipality, and the Olifants River, which drains the Cederberg and the northern part of the municipality.

The southernmost part of the district, adjacent to Cape Town, is known as the Swartland and is primarily a grain-farming area. The Berg River flows across the Swartland from its sources in the Boland mountains. On the coast west of the Swartland is the Cape Columbine peninsula, with a number of coastal holiday resorts as well as the ore-export harbour at Saldanha Bay. On the north the Swartland is bounded by mountains which separate it from the Olifants River Valley.

The upper valley of the Olifants is predominantly a citrus-farming region. The Cederberg mountains, much of which are a protected wilderness area, rise from the eastern bank of the river, while along the coast to the west are fishing and holiday villages. The Olifants river continues northwards until, on the edge of the Knersvlakte, it turns west towards the Atlantic. In the lower valley there is a narrow strip of lush agricultural land irrigated by the river's water. The Knersvlakte, which is part of the arid Namaqualand region, forms the northernmost part of the district.

The largest towns in the district are Vredenburg and Saldanha on the Cape Columbine peninsula, Malmesbury in the Swartland, and Vredendal in the Olifants River Valley. The district is divided into five local municipalities which are described in the following table.

NameSeatPopulation
(2011)
Area
(km2)
Density
(inhabitants/km2)
Matzikama [4] Vredendal 67,14712,9815.2
Cederberg [5] Clanwilliam 49,7688,0076.3
Bergrivier [6] Piketberg 61,8974,40714.0
Saldanha Bay [7] Vredenburg 99,1932,01549.2
Swartland [8] Malmesbury 113,7623,70730.7
Total391,76731,11912.6

The district borders to the north and northeast on the Namakwa District Municipality in the Northern Cape province, to the southeast on the Cape Winelands District Municipality, and to the south on the City of Cape Town.

Demographics

The following statistics are from the 2011 Census. [9] Note that due to fuzzing applied to statistics, columns may not sum to exactly the indicated total.

First language

LanguagePopulation%
Afrikaans 311,82983.7%
Xhosa 31,9788.6%
English 14,8284.0%
Sotho 4,6681.3%
Tswana 2,3580.6%
Sign language 1,1460.3%
Zulu 8330.2%
Ndebele 6830.2%
Tsonga 4480.1%
Venda 3270.1%
Northern Sotho 3220.1%
Swazi 2060.1%
Other 3,0430.8%
Total372,669
Not applicable19,099

Race

RacePopulation%
Coloured 260,85066.6%
Black African 64,11016.4%
White 61,52715.7%
Indian or Asian 2,1810.6%
Other3,0980.8%
Total391,766

Gender

GenderPopulation%
Female197,22750.3%
Male194,53949.7%
Total391,766

Age

Age groupPopulation%
0–436,6689.4%
5–931,8598.1%
10–1431,1968.0%
15–1932,4318.3%
20–2437,7299.6%
25–2936,8329.4%
30–3429,5567.5%
35–3928,8557.4%
40–4428,5827.3%
45–4924,8056.3%
50–5420,8785.3%
55–5916,2994.2%
60–6412,5133.2%
65–698,9442.3%
70–746,4131.6%
75–794,1581.1%
80–842,3360.6%
85+1,0780.3%
Total391,766

Politics

The council of the West Coast District Municipality consists of twenty-five councillors, of whom ten are directly elected by party-list proportional representation. The other fifteen councillors are appointed by the councils of the five local municipalities in the district: Saldanha Bay appoints five, Swartland appoints four, and Matzikama, Cederberg and Bergrivier appoint two each. After the elections of 3 August 2016 there are sixteen councillors from the Democratic Alliance (DA) and nine from the African National Congress (ANC). [10]

The following table shows the composition of the council after the 2016 election. [10]

PartyDirectly
elected
Appointed by local councilsTotal
MatzikamaCederbergBergrivierSaldanha BaySwartland
DA 71113316
African National Congress 3111219

The following table shows the results of the election of the ten directly-elected councillors. [11] [12]

PartyVotesVote %Seats
DA 70,89363.17
African National Congress 34,51230.73
Economic Freedom Fighters 2,4622.20
VF+ 1,3131.20
Khoisan Revolution6850.60
United Democrats5980.50
Saldanha Bay Residents Alliance5780.50
Nationalist Coloured Party4340.40
Cape Party 3610.30
National Democratic Party2980.30
The Peoples Independent Civic Organisation 1580.10
Democratic New Civic Association1310.10
Valid votes112,42310
Valid votes112,42398.2
Spoilt votes 2,0931.8
Total votes cast114,516
Registered voters187,386
Turnout percentage61.1

Mayors

References

  1. "Contact list: Executive Mayors". Government Communication & Information System. Retrieved 22 February 2012.
  2. West Coast District Municipality
  3. 1 2 3 4 "Statistics by place". Statistics South Africa. Retrieved 27 September 2015.
  4. "Matzikama Local Municipality". The Local Government Handbook. Retrieved 24 May 2013.
  5. "Cederberg Local Municipality". The Local Government Handbook. Retrieved 24 May 2013.
  6. "Bergrivier Local Municipality". The Local Government Handbook. Retrieved 24 May 2013.
  7. "Saldanha Bay Local Municipality". The Local Government Handbook. Retrieved 24 May 2013.
  8. "Swartland Local Municipality". The Local Government Handbook. Retrieved 24 May 2013.
  9. Census 2011 statistical tables accessible through Stats SA SuperWEB Archived 2013-09-30 at the Wayback Machine .
  10. 1 2 "Political composition of councils February 2017" (PDF). Western Cape Department of Local Government. February 2017. Archived from the original (PDF) on 26 August 2018. Retrieved 24 May 2017.
  11. "Detailed DC 40% Ballot Results Report: DC1 - West Coast" (PDF). Electoral Commission. Retrieved 27 May 2017.
  12. "Seat Calculation Detail: DC1 - West Coast" (PDF). Electoral Commission. Retrieved 27 May 2017.