Phokwane Local Municipality

Last updated
Phokwane
Phokwane CoA.png
Map of the Northern Cape with Phokwane highlighted (2011).svg
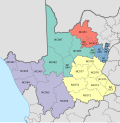
Location in the Northern Cape
Coordinates: 27°50′S24°50′E / 27.833°S 24.833°E / -27.833; 24.833
Country South Africa
Province Northern Cape
District Frances Baard
Seat Hartswater
Wards 10
Government
[1]
  Type Municipal council
  MayorVuyisile Khen
Area
  Total
834 km2 (322 sq mi)
Population
 (2022) [2]
  Total
80,481
  Density97/km2 (250/sq mi)
Racial makeup (2011)
[2]
   Black African 81.9%
   Coloured 8.6%
   Indian/Asian 0.5%
   White 8.9%
First languages (2011)
[3]
   Tswana 66.6%
   Afrikaans 18.9%
   Xhosa 5.6%
   English 3.9%
  Other5%
Time zone UTC+2 (SAST)
Municipal codeNC094

Phokwane Municipality (Tswana : Mmasepala wa Phokwane; Afrikaans : Phokwane Munisipaliteit) is a local municipality within the Frances Baard District Municipality, in the Northern Cape province of South Africa. The name means "small Billy goat" in Setswana. [4]

Contents

Main places

The 2011 census divided the municipality into the following main places: [5]

PlaceCodeArea (km2)Population
Banksdrif 386001 1.1505
Ganspan 386006 1.22,301
Hartswater 386003 10.810,465
Jan Kempdorp 386005 19.124,220
Pampierstad 386004 10.421,707
Remainder 386002 791.33,802
Total833.963,000

Politics

The municipal council consists of nineteen members elected by mixed-member proportional representation. Ten councillors are elected by first-past-the-post voting in ten wards, while the remaining nine are chosen from party lists so that the total number of party representatives is proportional to the number of votes received. In the election of 1 November 2021 the African National Congress (ANC) won a majority of ten seats on the council. [6] [7] The following table shows the results of the election.

Phokwane local election, 1 November 2021
PartyVotesSeats
WardListTotal %WardListTotal
African National Congress 7,5097,48614,99547.2%10010
Economic Freedom Fighters 3,6793,7467,42523.4%044
Democratic Alliance 1,8331,8583,69111.6%022
Freedom Front Plus 9319011,8325.8%011
Phokwane Service Delivery Forum4985711,0693.4%011
Forum for Service Delivery 3384047422.3%011
Patriotic Front of Azania2944087022.2%000
Patriotic Alliance 1672163831.2%000
Independent candidates 3723721.2%00
Azanian People's Organisation 1441482920.9%000
African People First1111110.3%00
African Christian Democratic Party 48561040.3%000
United Christian Democratic Party 3435690.2%000
Total15,95815,82931,78710919
Valid votes15,95815,82931,78797.3%
Spoilt votes 4554428972.7%
Total votes cast16,41316,27132,684
Voter turnout16,440
Registered voters32,409
Turnout percentage50.7%

References

  1. "Contact list: Executive Mayors". Government Communication & Information System. Archived from the original on 14 July 2010. Retrieved 22 February 2012.
  2. 1 2 "Statistics by place". Statistics South Africa. Retrieved 17 February 2025.
  3. "Statistics by place". Statistics South Africa. Retrieved 27 September 2015.
  4. South African Languages - Place names
  5. "Phokwane Local Municipality". Census 2011.
  6. "Results Summary - All Ballots" (PDF). Electoral Commission of South Africa. 8 November 2021. Retrieved 12 November 2021.
  7. "Seat Calculation Detail" (PDF). Electoral Commission of South Africa. 8 November 2021. Retrieved 12 November 2021.