Pixley ka Seme District Municipality

Last updated

Pixley ka Seme
Pixley ka Seme DM CoA.png
Map of South Africa with Pixley ka Seme highlighted (2011).svg
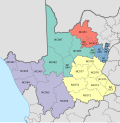
Location in South Africa
Coordinates: 30°30′S23°30′E / 30.500°S 23.500°E / -30.500; 23.500
Country South Africa
Province Northern Cape
Seat De Aar
Local municipalities
Government
[1]
  Type Municipal council
  MayorJohn Lolwana
Area
  Total
103,410 km2 (39,930 sq mi)
Population
 (2022) [2]
  Total
216,589
  Density2.1/km2 (5.4/sq mi)
Racial makeup (2022)
[2]
   Black African 29.8%
   Coloured 59.5%
   Indian/Asian 0.8%
   White 9.9%
First languages (2011)
[3]
   Afrikaans 76.8%
   Xhosa 17.5%
   English 1.6%
   Tswana 1.6%
  Other2.5%
Time zone UTC+2 (SAST)
Municipal codeDC7

The Pixley ka Seme District Municipality (Afrikaans : Pixley ka Seme-distriksmunisipaliteit; Xhosa : uMasipala weSithili sase Pixley ka Seme) is one of the five districts of the Northern Cape province of South Africa. The seat of Pixley ka Seme is De Aar. As of 2011, a majority (77%) of its 186,351 residents speak Afrikaans as a first language. The district code is DC7. It is named after Pixley ka Isaka Seme, one of the founders of the African National Congress.

Contents

Geography

Neighbours

Pixley ka Seme is surrounded by other districts as follows:

Local municipalities

The district contains the following local municipalities:

Local municipalityPopulation (2022)%Dominant language
Emthanjeni 46,58721,5 Afrikaans
Siyancuma 54,16525.1Afrikaans
Umsobomvu 29,55513.6 Xhosa
Siyathemba 27,10512.5Afrikaans
Ubuntu 15,8367.3Afrikaans
Thembelihle 22,54210.4Afrikaans
Kareeberg 10,9615.0Afrikaans
Renosterberg 10,8435.0Afrikaans

Demographics

The following statistics are from the 2011 and 2022 census.

LanguagePopulation (2011)%
Afrikaans 140,64176.79%
IsiXhosa 32,01717.48%
English2,9911.63%
Tswana 2,9221.60%
Sesotho 1,4830.81%
Other 9410.51%
Sign language 7450.41%
IsiZulu 4460.24%
IsiNdebele 2980.16%
Sepedi 2860.16%
Tshivenda 1710.09%
Xitsonga 1080.06%
SiSwati 1040.06%

Gender

GenderPopulation (2011)%Population (2022)%
Female94,28450.59112 05151.7
Male92,06849.41104 53848.3

Ethnic group

Ethnic groupPopulation (2011)%Population (2022)%
Coloured110,25759.17128 78959.5
Black African58,61431.4564 46129.8
White15,0648.0821 4369.9
Indian/Asian1,0460.561 6960.8
Other1,3710.741850.1

Age

AgePopulation (2011)%Population (2022)%
000–00417 11410.4020 9529.6
005–00917 86910.8620 1509.3
010–01418 74411.3920 7539.5
015–01917 63810.7220 5139.5
020–02412 7967.7718 3678.5
025–02911 9707.2717 0537.9
030–03411 8587.2016 1847.5
035–03910 9976.6815 1387.0
040–0449 6645.8712 9426.0
045–0498 7615.3211 2615.2
050–0547 0904.3111 0665.2
055–0595 5813.399 7334.5
060–0644 7202.877 9333.7
065–0693 7332.276 1482.8
070–0742 4881.513 9481.8
075–0791 6921.032 3291.1
080–0841 1230.681 2050.6
085–0894890.30845 (85+)0.4
090–0942170.13--
095–099510.03--
100 plus130.01--

Politics

Election results

Election results for Pixley ka Seme in the South African general election, 2004.

PartyVotes%
African National Congress 43 61865.51%
New National Party 8 73013.11%
Democratic Alliance 7 06710.61%
Independent Democrats 3 2984.95%
Freedom Front Plus 1 2251.84%
African Christian Democratic Party 1 1541.73%
Pan Africanist Congress 3050.46%
United Democratic Movement 2400.36%
Inkatha Freedom Party 1360.20%
NA 1100.17%
PJC 1050.16%
United Christian Democratic Party 1040.16%
Azanian People's Organisation 970.15%
EMSA 710.11%
TOP 630.09%
NLP 600.09%
KISS 500.08%
SOPA 500.08%
CDP 430.06%
UF 430.06%
Minority Front 160.02%
Total66 585100.00%

See also

References

  1. "Contact list: Executive Mayors". Government Communication & Information System. Archived from the original on 14 July 2010. Retrieved 22 February 2012.
  2. 1 2 "Statistics by place". Statistics South Africa. Retrieved 16 March 2025.
  3. "Statistics by place". Statistics South Africa. Retrieved 16 March 2025.