Old Jamestown, Missouri | |
---|---|
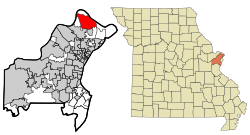
![]() Location of Old Jamestown, Missouri | |
Coordinates: 38°50′21″N90°16′55″W / 38.83917°N 90.28194°W | |
Country | ![]() |
State | ![]() |
County | St. Louis |
Townships | Lewis and Clark, Spanish Lake |
Area | |
• Total | 14.96 sq mi (38.73 km2) |
• Land | 14.95 sq mi (38.71 km2) |
• Water | 0.01 sq mi (0.02 km2) |
Elevation | 538 ft (164 m) |
Population (2020) | |
• Total | 19,790 |
• Density | 1,324.10/sq mi (511.23/km2) |
Time zone | UTC-6 (Central (CST)) |
• Summer (DST) | UTC-5 (CDT) |
ZIP codes | 63033, 63034 |
Area code(s) | 314/557 |
FIPS code | 29-54352 [3] |
GNIS feature ID | 2583784 [2] |
Website | oldjamestownassn.org |
Old Jamestown is an unincorporated community and census-designated place (CDP) in St. Louis County, Missouri, United States. The population was 19,790 at the 2020 census. Old Jamestown is northwest of the city of St. Louis and borders the Missouri River.
According to the United States Census Bureau, the CDP has a total area of 14.9 square miles (38.7 km2), of which 0.008 square miles (0.02 km2), or 0.06%, is water. [4] The community is located mostly to the north and west of U.S. Route 67 in northern St. Louis County. West Alton is to the north, across the Missouri River. Florissant is to the southwest, and Black Jack and Spanish Lake are to the south. The CDP is located 17 miles (27 km) north of downtown St. Louis.
Census | Pop. | Note | %± |
---|---|---|---|
2010 | 19,184 | — | |
2020 | 19,790 | 3.2% | |
U.S. Decennial Census [5] |
Old Jamestown first appeared as a census designated place in the 2010 U.S. Census.
Race / Ethnicity (NH = Non-Hispanic) | Pop 2010 [6] | Pop 2020 [7] | % 2010 | % 2020 |
---|---|---|---|---|
White alone (NH) | 7,928 | 4,832 | 41.33% | 24.42% |
Black or African American alone (NH) | 10,253 | 13,531 | 53.45% | 68.37% |
Native American or Alaska Native alone (NH) | 23 | 26 | 0.12% | 0.13% |
Asian alone (NH) | 336 | 307 | 1.75% | 1.55% |
Native Hawaiian or Pacific Islander alone (NH) | 11 | 3 | 0.06% | 0.02% |
Other race alone (NH) | 34 | 132 | 0.18% | 0.67% |
Mixed race or Multiracial (NH) | 324 | 636 | 1.69% | 3.21% |
Hispanic or Latino (any race) | 275 | 323 | 1.43% | 1.63% |
Total | 19,184 | 19,790 | 100.00% | 100.00% |
The vast majority of the CDP is in the Hazelwood School District. A small portion is in the Ferguson-Florissant School District. [8]